Geography GeniusesFree preview
The geography behind power, wealth and conflict.
Why does Greenland look as big as Africa on the wall map?Why is one border a straight line and another a wiggle?And how can one narrow strait of sea change prices in your town?This course shows the geography hiding in the news, and in your own street.
- Read a map with care: its projection, its scale and the choices of whoever drew it.
- Explain why borders sit where they do, and how rivers and resources make neighbours cooperate or quarrel.
- Describe how cities grow and why people move, including when the climate pushes them.
- Trace the trade routes and chokepoints your daily life depends on.
 With Swagat YadavFounder and CEO, One Young India, and author of Learnacy
This course is for learning. Every map you play with in it is made up. Wherever it describes India, it follows the Government of India's official maps (Survey of India). It takes no side in any border dispute or in party politics, and names no company to praise or blame.
Geography is everywhere
You read maps, wait for the monsoon and use things that crossed oceans.This course shows how the shape of the Earth quietly shapes power, wealth and conflict.
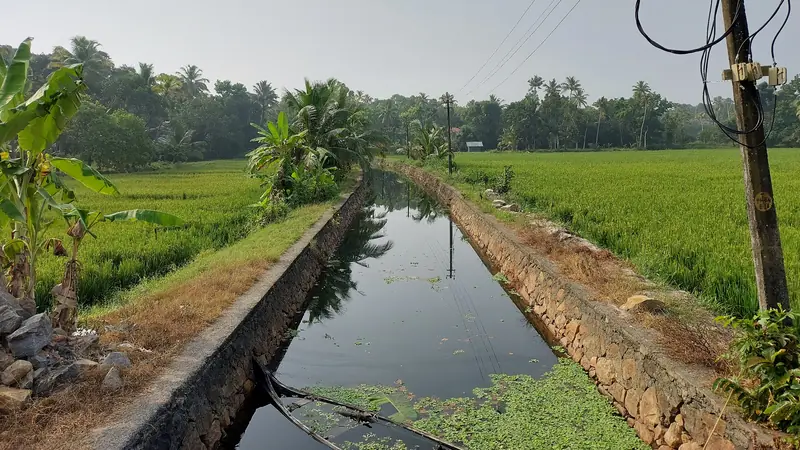
A canal between paddy fields at Thanneermukkom, in Kerala's Alappuzha district. Rice needs the right soil and the right water, and here they meet.Photo: Vis M, CC BY-SA 4.0, via Wikimedia Commons. Cropped by One Young India. The crop is shared under the same licence.
- Geography is the ground under everyday decisions: food, weather, travel, the things we use.
- This course shows how geography shapes power, wealth and conflict.
- Every map you play with here is made up; every real figure names its source.
What the internet cannot move
A video call joins two continents in a second, and the internet reaches almost everywhere. So is distance dead?
Before you answer, start with your last meal. If it was rice, wheat or dal, somebody grew it on a particular kind of soil, with water from a particular river or well. And if there is a phone near you, the metals inside it were dug out of the ground in a few places on Earth, and some of its parts almost certainly crossed an ocean to reach you.
Then there is the rest of the day. Checking how long a trip will take is geography. So is the weather, when it decides what you wear, or whether you go out at all.
The map on the classroom wall is geography, and so is the ground under every decision. This course is about that quiet geography, and about the people who use it to gain power, to grow rich, or to fight.
So, is distance dead?
Your answer
Anonymous: we count answers, nothing else.
What does your gut say?
Three quick questions before we begin. There is no score, and nothing leaves this page. At the end of the course you will see your first answers next to what you know by then.
How this course works
Four parts and 26 chapters, then a wrap-up, about 12 hours, at your own pace. Each chapter has:
- a story, something to try and a question to argue about,
- an "In short" box at the top, so you can see the main points first,
- a link into World 101, Learnacy's map of what the world knows, and sometimes a Learnacy Lab to play with,
- a note for your notebook, and
- a five-question check. Pass it with 4 right, as often as you need.
Pass every chapter check and the final round, and you get a certificate of completion with a link anyone can use to verify it.
Two promises
Every map you play with in this course is made up: invented islands, rivers and countries, so that you can test an idea without arguing over a real line. And every real figure comes from a named source, with its date. Wherever the course describes India, it follows the Government of India's official maps, made by the Survey of India.
One rule for the whole course: questions are more important than answers. "Why is it here and not there?" is the oldest question in geography, and it is still the best one.
Explore in World 101
Geography has a whole field in World 101. For five minutes, put geography's oldest question to Borders and Geopolitics: why here, and not there? Write down the first question you cannot answer. At the end of the course you choose a question to write on, and you may choose this one.
Geography is about why things happen where they happen.
One thing in my town that is where it is because of geography.
Why every flat map lies
Peel an orange and try to press the peel flat.It tears or it stretches. Every flat map of the round Earth has the same problem.
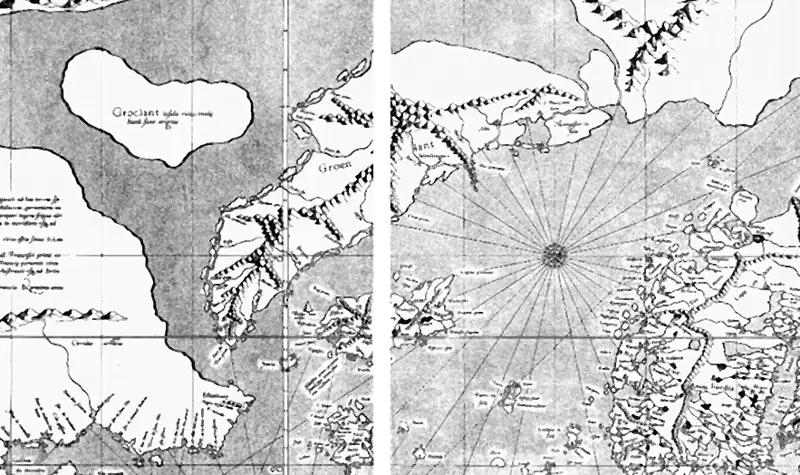
Mercator's world map of 1569, around Greenland, which it draws far bigger than it is. The white line is where two of the map's 18 printed sheets meet.Map: Gerardus Mercator, public domain (author died more than 70 years ago), via Wikimedia Commons. Cropped by One Young India.
- The Earth is round and a map is flat, so every flat map stretches or tears something.
- A projection is a way of flattening the globe; each one chooses what to keep true.
- The Mercator map keeps directions true for sailors and stretches areas far from the equator.
- Equal-area maps keep sizes true and bend shapes; only a globe keeps everything.
An orange that will not lie flat
Take an orange. Peel it in one piece if you can, then try to press the peel flat on a table. Can you do it without tearing it? No. Without stretching it? No. So what do you have to give up? Something. Every time.
The Earth is round, very close to a ball. A map is flat. So every flat map of the whole world tears the Earth, or stretches it, or both. Mapmakers have a word for the way they flatten the globe: a projection. There are hundreds of projections, and not one of them is perfect. Each one chooses what to get right and what to get wrong.
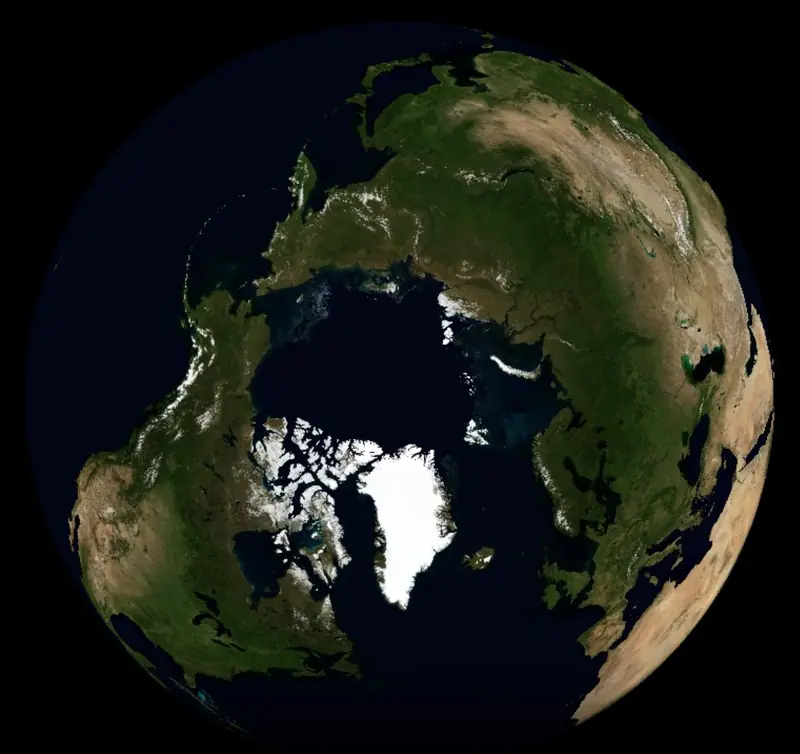
Now picture a world map on a classroom wall. On many such maps, Greenland looks about as big as Africa. Greenland covers about 2,166,000 square kilometres and Africa about 29,648,000 square kilometres, so Africa is about 14 times bigger. The map on the wall has been misleading you, and for a reason.
Before you read the two sides. Should classroom wall maps stop using the Mercator projection?
Your answer now
Anonymous: we count answers, nothing else.
The map sailors needed
Why would anyone draw a map that makes Greenland so big? Because it was not made for comparing sizes. It was made for sailing.
In 1569 a Flemish mapmaker, Gerardus Mercator, published a world map for sailors, and its own title said it was adapted for the use of navigators. On Mercator's map, a straight line is a line of constant compass direction. A navigator could rule a line from port to port, read its angle, and steer by the compass the whole way. At sea, that was worth a great deal.
But there was a price. To keep every angle true, the map has to stretch the world sideways more and more with distance from the equator, and stretch it upwards by exactly the same amount. Near the equator, almost nothing is stretched. Far from it, everything is drawn bigger. Close to the poles the stretching runs away without limit, so the map is usually cut off before it reaches them.
Does that make the Mercator map wrong? No: it is right about one thing, direction, and wrong about another, size. Every map is a choice, and you should know which choice you are looking at.
How much does it stretch?
Here is the mathematics in plain words. On a Mercator map, the stretch depends only on latitude: how far north or south of the equator a place is, in degrees. At the equator the stretch is 1, nothing at all. At 60 degrees from the equator, the map draws every length twice as long as it should. And every area? Four times as big.
Why four, if each length is only doubled? Area is length times width. Double the length and double the width, and you get four times the area. That is why land near the poles grows so much on the wall map, and why Greenland, far to the north, swells to the size of a continent.
Stretch the map
Slide a made-up square of land, 100 kilometres on each side, from the equator towards the pole. Watch how big a Mercator map draws it.
A made-up square of land, 100 km on each side. Slide it away from the equator.
Each side drawn:
Area drawn:
True sizes or true shapes?
If you want sizes right, you can choose an equal-area projection. It keeps every country at its true size compared with the others, but it squashes shapes, so countries near the edges look bent or stretched thin. On an equal-area map, Africa suddenly looks enormous. It is.
A map that keeps angles true has an opposite: one that gives up true angles to keep true areas. No flat map can keep both, everywhere.
Mathematicians proved long ago that a ball cannot be flattened without distortion. Carl Friedrich Gauss proved it in 1827, in a result he called the Theorema Egregium, the remarkable theorem: bending a surface never changes its curvature, so a sphere can never be laid flat without distortion.
And the globe? A globe keeps everything true: sizes, shapes, angles, distances. So why do we not always use one? You cannot fold it into a book. You cannot see the whole world at once. You cannot zoom into your street on it. Every tool trades something away.
Which map keeps what true? Guess, then tap.
Should classroom wall maps stop using the Mercator projection?
Some say every classroom wall map should use an equal-area projection, so that children see the true size of every continent.
A map on the wall shapes how children picture the world for life. If lands far from the equator look bigger than they are, and lands near it look smaller, children learn a false sense of which places are large and which are small. An equal-area map fixes that at almost no cost.
The Mercator map is familiar, and its shapes look right, which helps children learn where countries are. Online street maps use a version of it for good reasons. Teaching children to question every map does more good than swapping one imperfect map for another.
A hard case. A world map of the languages people speak, to hang in a school corridor. Would you choose true sizes or true shapes?
Find two world maps drawn in two different projections, in an atlas or online. Compare the sizes of three countries on both. Which map would change a reader's mind about something, and what?
After the debate. Should classroom wall maps stop using the Mercator projection?
Your answer after the debate
Anonymous: we count answers, nothing else.
Explore in World 101
Mapmaking is both a science and an art. Open Cartography and Map Design in World 101 and walk its thread to Geometry in the Real World. Before you read why the two are joined, explain it yourself, with the orange peel.
Find the number
Find the area of India in square kilometres from an official Government of India source, and the area of Greenland from a reputable source. Which is bigger, and by how many times? Now find both on a Mercator world map. Does the map agree?
Check your understanding
Five questions. Pass with 4 right; try as often as you like. Each answer comes with its reason.
Every map is a choice about what to get right and what to get wrong.
One map I use often, and one thing it might be getting wrong.
That was chapter 1 of 26
Next
- Finding any place on Earth
- Scale
- Maps that persuade
- Who draws the map
- Borders and the rivers that cross them
- Resources
- The megacity
- Climate migration
- The chokepoints the world's trade squeezes through
Four parts, about 12 hours, then the final round and your completion certificate.
Already a member? Continue in part 1. The check you passed here carries over when you are logged in. Course home