
Cartesian System | ICSE Class 9 Maths Notes
On this page

This note covers the Cartesian plane, coordinate axes, the origin, ordered pairs, the signs of coordinates, quadrants, points on the axes, reading and plotting points, dependent and independent variables, and checks for accurate coordinate diagrams.
What is the Cartesian system used for?
A coordinate system is a framework for describing the location of a point using numbers. A point marks an exact position. A plane is a flat surface extending in all directions; a sheet of graph paper represents part of it.
A number line describes positions along one direction. To locate points in a plane, we use two directions. This is a two-dimensional arrangement: positions are described horizontally and vertically. The abbreviation 2-D means two-dimensional.
Why are two reference lines needed?
The Cartesian system uses two perpendicular number lines. Perpendicular lines meet at a right angle. One line is horizontal, running from left to right; the other is vertical, running upwards and downwards. These lines provide a common reference for locating points.
The horizontal line is the x-axis, and the vertical line is the y-axis. Together they are the coordinate axes; “axes” is the plural of “axis”. The point where the axes intersect, or cross, is the origin, labelled O.
The Cartesian plane, also called the coordinate plane or xy-plane, is the plane containing these axes. Here x names the horizontal coordinate and y names the vertical coordinate. Their values describe a point's position relative to the origin.
Definition: The coordinates of a point are the two numbers that locate it relative to the coordinate axes, written as an ordered pair: two numbers in a fixed order, with the horizontal coordinate first and the vertical coordinate second.
How does this connect a picture with numbers?
A marked point can be described by reading two numbers. Conversely, two coordinates tell us where to mark a point. Reading and plotting are therefore opposite tasks using the same system. The axes and their numbered divisions must be clear in both tasks.
A floor plan illustrates this idea. Its points describe positions across the floor, but those two coordinates do not also give an object's height. A position in a plane uses the two chosen directions, so the meaning of the representation matters.
How are the axes, origin and scale arranged?
Both axes pass through O. The origin has coordinates (0, 0): its horizontal coordinate is zero and its vertical coordinate is zero. The two zero values refer to different directions, even though they describe the same starting point.
What do positive and negative directions mean?
A positive number is greater than zero; a negative number is less than zero. Along the x-axis, positions to the right of O are positive and positions to its left are negative. Along the y-axis, positions above O are positive and positions below O are negative. The minus sign, −, before a coordinate indicates a negative value.
A unit is the fixed interval used for measurement on an axis. Mark equal units at equal spacings. A scale tells us how a drawn length represents coordinate units. The symbol = means “is equal to”, and cm abbreviates centimetre. For example, the scale 1 cm = 1 unit means one centimetre represents one coordinate unit.
| Direction from O | Axis | Sign of the changing coordinate |
|---|---|---|
| Right | x-axis | Positive x |
| Left | x-axis | Negative x |
| Up | y-axis | Positive y |
| Down | y-axis | Negative y |
What the figure shows
Structure of the coordinate plane
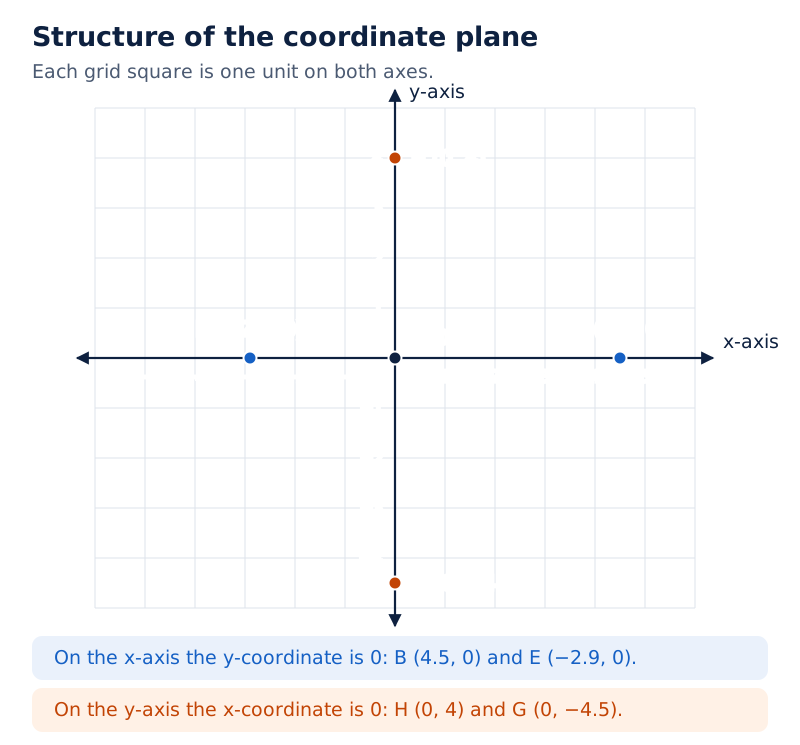
The horizontal x-axis and vertical y-axis cross at O (0, 0). B (4.5, 0) lies to the right, E (−2.9, 0) to the left, H (0, 4) above and G (0, −4.5) below the origin.
Drawn by One Young India.
How should a graph be prepared?
- Draw the horizontal and vertical axes so that they meet at a right angle.
- Label their intersection O and identify the x-axis and y-axis.
- Choose and state the scale, then mark equal coordinate intervals at equal spacings.
- Label positive and negative values in the correct directions before locating points.
Read the scale before counting squares. A square on the paper is a drawn interval; the scale tells you the coordinate interval it represents. A point halfway between consecutive unit marks has a fractional coordinate, so points are not restricted to whole-number labels.
What is an ordered pair, and why does its order matter?
An ordered pair consists of two numbers written in a specified order inside brackets, separated by a comma. In (x, y), x is the first coordinate and y is the second coordinate. The first number gives horizontal position; the second gives vertical position.
If P names a point, P (x, y) means that its x-coordinate is x and its y-coordinate is y. The notation P = (x, y) is also used. It is often convenient to omit the equals sign when labelling a point on a graph.
How are the coordinates measured?
The x-coordinate is measured horizontally from the y-axis, with its sign giving left or right. The y-coordinate is measured vertically from the x-axis, with its sign giving above or below. These measurements are perpendicular to the respective axes.
The x-coordinate is also called the abscissa, and the y-coordinate is called the ordinate. These terms name the first and second entries respectively; they do not change the order in which a coordinate pair is written.
Result: Interchanging coordinates preserves a point exactly when the coordinates are equal
The symbol ≠ means “is not equal to”. The pairs (x, y) and (y, x) represent the same point if and only if x = y. When x ≠ y, interchanging them gives different points.
Worked example 1. Compare the positions S (3, −5) and Q (−5, 3). What changes when their coordinates are interchanged?
Answer: S is 3 units right of the y-axis and 5 units below the x-axis. Q is 5 units left of the y-axis and 3 units above the x-axis. Their coordinate entries are interchanged, and they occupy different positions.
The comma separates two positions in an ordered description; it is not an instruction to add the numbers. Keep each number attached to its coordinate name. Reading “x is 3, y is −5” makes the meaning of S (3, −5) explicit.
How do coordinate signs identify the four quadrants?
The axes divide the plane into four regions called quadrants. The Roman numerals I, II, III and IV mean first, second, third and fourth. Quadrant I is above the x-axis and to the right of the y-axis.
Quadrant II is above and to the left; Quadrant III is below and to the left; Quadrant IV is below and to the right. The numbering therefore goes anticlockwise, meaning opposite to the direction in which a clock's hands move, starting at the upper right.
Property: Each quadrant has a fixed pair of coordinate signs
The sign of x determines which side of the y-axis contains the point. The sign of y determines which side of the x-axis contains it. Combine both pieces of information to identify the quadrant; either sign alone leaves more than one possible region.
| Quadrant | x-coordinate | y-coordinate | Position |
|---|---|---|---|
| I | Positive | Positive | Upper right |
| II | Negative | Positive | Upper left |
| III | Negative | Negative | Lower left |
| IV | Positive | Negative | Lower right |
What the figure shows
Quadrants and coordinate signs
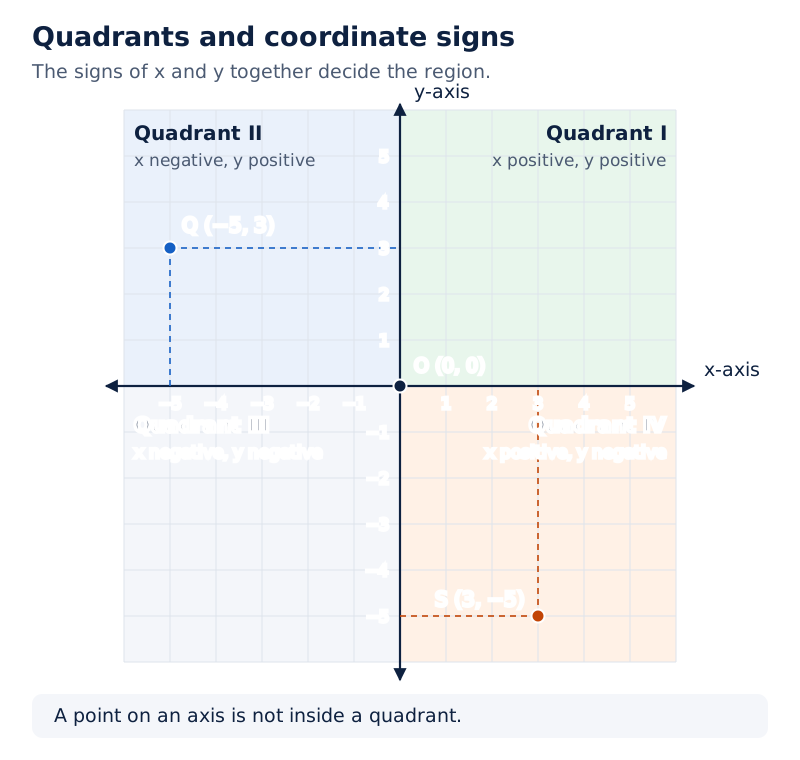
The axes divide a numbered grid into four labelled quadrants. Q (−5, 3) is shown in Quadrant II and S (3, −5) in Quadrant IV. The origin O (0, 0) is at the intersection of the axes.
Drawn by One Young India.
Worked example 2. Identify the quadrants containing Q (−5, 3) and S (3, −5).
Answer: Q has negative x and positive y, so it is in Quadrant II. S has positive x and negative y, so it is in Quadrant IV. The signs decide the quadrants without requiring a full drawing.
A coordinate equal to zero needs a separate check. Such a point is on an axis rather than inside a quadrant. Zero is neither positive nor negative, so it cannot simply replace one of the signs in the quadrant table.
How can you recognise points on an axis or at the origin?
A point on the x-axis has no upward or downward separation from it. Its y-coordinate is therefore zero. A point on the y-axis has no leftward or rightward separation from it, so its x-coordinate is zero.
Property: Axis points have a zero coordinate
The general form of an x-axis point is (x, 0). The general form of a y-axis point is (0, y). The origin fits both forms because both its coordinates are zero. It is the intersection of the two axes.
For a point on the x-axis, the non-zero x-coordinate specifies right or left of O. For a point on the y-axis, the non-zero y-coordinate specifies above or below O. The zero entry identifies the axis; the other entry specifies its position along that axis.
| Point | Coordinate that is zero | Location |
|---|---|---|
| B (4.5, 0) | y | Positive x-axis |
| E (−2.9, 0) | y | Negative x-axis |
| H (0, 4) | x | Positive y-axis |
| G (0, −4.5) | x | Negative y-axis |
| O (0, 0) | Both x and y | Origin, on both axes |
Worked example 3. Locate B (4.5, 0) and G (0, −4.5), explaining the role of zero.
Answer: B lies on the x-axis, 4.5 units to the right of O, because its y-coordinate is zero. G lies on the y-axis, 4.5 units below O, because its x-coordinate is zero and its y-coordinate is negative.
Note: A point on an axis is not inside a quadrant. Check for zero coordinates before applying the quadrant sign table, and identify O separately when both coordinates are zero.
Do not name an axis from the coordinate that vanishes. The statement x = 0 puts a point on the y-axis. The statement y = 0 puts it on the x-axis. Relate each zero to the direction in which there is no separation.
How do you read coordinates from a diagram?
Reading coordinates means finding the ordered pair belonging to a point already marked on a graph. Start by identifying the axes, origin and scale. Then read the horizontal and vertical positions separately, keeping the correct signs. For an axis point, read its position directly on that axis and set the other coordinate to zero.
What is the reading procedure?
- For a point off the axes, follow a vertical line from it to the x-axis. This line is parallel to the y-axis, meaning it runs in the same direction without meeting it.
- Read the x-coordinate at that position on the horizontal axis. Include a negative sign when the position is left of O.
- From the point, follow a horizontal line to the y-axis and read the y-coordinate. Include a negative sign when it is below O.
- Write the result as (x, y), with the horizontal reading first, and compare the signs with the point's location.
The vertical guide helps read x, while the horizontal guide helps read y. This can feel reversed at first. Each guide takes you to the axis on which the required coordinate is numbered; the direction of the guide does not name the coordinate.
Worked example 4. A point H is on the y-axis, 4 units above O. A point E is on the x-axis, 2.9 units left of O. Write their coordinates.
Answer: H has horizontal coordinate 0 and vertical coordinate 4, giving H (0, 4). E has horizontal coordinate −2.9 and vertical coordinate 0, giving E (−2.9, 0). Their positions on the axes supply the zero coordinates.
How do you distinguish a coordinate from a distance?
A distance gives the size of a separation and is not negative. A coordinate combines a position value with a direction through its sign. E has x-coordinate −2.9, but its distance from O along the x-axis is 2.9 units.
Likewise, G (0, −4.5) is 4.5 units below O. Keep the minus sign in the coordinate pair, but use the positive distance together with the word “below” when describing the location in words.
How do you plot points with positive coordinates?
Plotting a point means marking its location from a given ordered pair. Prepare the axes and scale first. For a positive x-coordinate, count to the right from O; for a positive y-coordinate, count upwards from the corresponding horizontal position.
What does each step achieve?
The horizontal step fixes the required x-coordinate. The vertical step then fixes y while leaving x unchanged. Their combined effect locates the point. Mark a clear dot and label it with the point's name and coordinates so that the construction can be checked.
Worked example 5. Plot A (3, 4) and explain its location.
Answer: From O, move 3 units right along the x-axis, then 4 units up parallel to the y-axis. Mark A at the endpoint. Both coordinates are positive, so A lies in Quadrant I.
Worked example 6. Plot D (7, 1) and M (9, 6) on the same coordinate plane.
Answer: For D, move 7 units right from O and then 1 unit up. For M, start again at O, move 9 units right and then 6 units up. Both points lie in Quadrant I because both entries in each pair are positive.
What the figure shows
Three points in the first quadrant
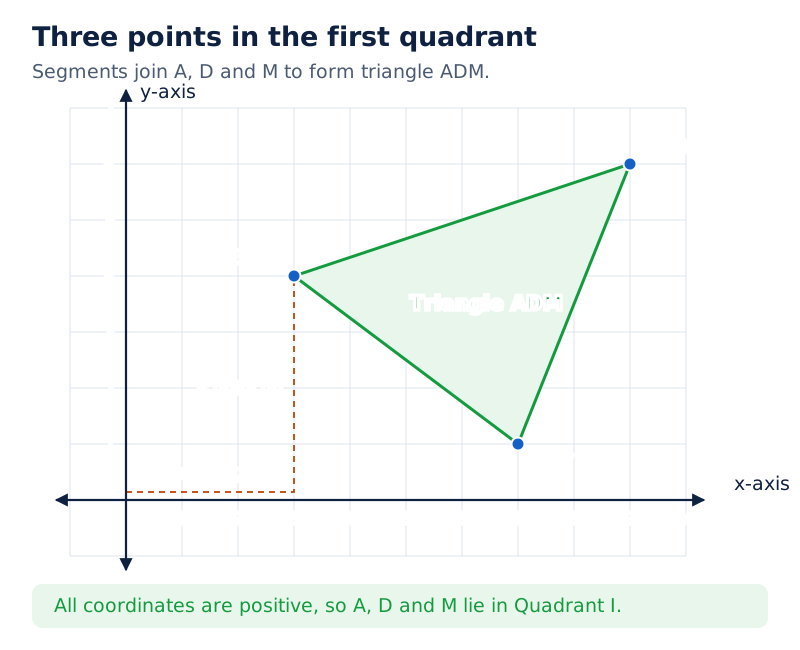
A numbered coordinate grid shows A (3, 4), D (7, 1) and M (9, 6). Straight line segments join the three labelled points to form a triangle. A line segment is the part of a straight line between two endpoints. The triangle lies above the x-axis and to the right of the y-axis.
Drawn by One Young India.
Why should each point be located from the same origin?
The coordinates of D refer to O, not to A. Similarly, M is located relative to O rather than relative to D. Starting the next coordinate count from the previous plotted point would change the reference and give an incorrect location.
Once a point is marked, read its coordinates back from the axes. This checks the complete position, including the numbers, their order and the scale. A point being in the correct quadrant is useful evidence, but does not establish its exact coordinates.
How do you plot negative and decimal coordinates?
The plotting procedure remains the same when coordinates are negative. The signs change the directions of movement. Read both coordinates before drawing, and decide whether the expected position is in a quadrant, on an axis, or at the origin.
How are mixed signs handled?
Worked example 7. Plot Q (−5, 3).
Answer: Move 5 units left from O, then 3 units up parallel to the y-axis. Mark Q at that position. Its negative x-coordinate and positive y-coordinate place it in Quadrant II.
Worked example 8. Plot S (3, −5).
Answer: Move 3 units right from O, then 5 units down parallel to the y-axis. Mark S at the endpoint. Its positive x-coordinate and negative y-coordinate place it in Quadrant IV.
Do not interpret a negative coordinate as a negative physical length to be drawn. For Q, the horizontal movement has length 5 units and direction left. For S, the vertical movement has length 5 units and direction down. The sign determines direction.
How are decimal positions marked?
A decimal coordinate is written using a decimal point and may locate a point between whole-number marks. Use the subdivisions of the chosen scale. Do not round the coordinate to a nearby whole number, because that would locate a different point.
Worked example 9. Plot the axis points B (4.5, 0), E (−2.9, 0) and G (0, −4.5).
Answer: B is 4.5 units right of O on the x-axis. E is 2.9 units left of O on the x-axis. G is 4.5 units below O on the y-axis. The decimal values set the exact positions; the zero entries keep the points on their respective axes.
After marking a decimal point, check its direction and its separation from the origin using the scale. The sign and decimal part both belong to the coordinate. Dropping either changes the location even if the point remains on the correct axis.
How do independent and dependent variables connect with coordinates?
A variable is a symbol representing a quantity whose value can vary. In a relationship where one quantity is chosen and another is determined from it, the chosen quantity is the independent variable. The resulting quantity is the dependent variable.
When x is chosen and y is calculated from a relationship, x is independent and y is dependent. The pair (x, y) then records a chosen value and its corresponding calculated value. It can be plotted using the same coordinate rules as any other ordered pair.
What information must the relationship provide?
An equation is a statement that two expressions have equal values. A solution of an equation in x and y is a pair of values that makes that equality true. Substitution means replacing symbols by specified values.
Consider 3x + 2y = 12, where x and y are numerical variables. Writing 3x means three multiplied by x, and 2y means two multiplied by y. The symbol + means addition. This equation links the possible values of the two variables.
Worked example 10. In 3x + 2y = 12, choose x = 2 and find the corresponding y-coordinate.
Answer: Substituting x = 2 gives 6 + 2y = 12. Subtracting 6 gives 2y = 6, so y = 3. The resulting ordered pair is (2, 3). Here x is the chosen input and y is the value determined from the equation.
Why must coordinate order still be preserved?
The pair records x first and y second even when it comes from an equation. Substituting the values back into the equation checks the relationship; reading the plotted point back from the axes checks its location. These checks answer different questions.
For the same equation, (4, 0) is also a solution: three multiplied by four, plus two multiplied by zero, gives twelve. This point is on the x-axis because its second coordinate is zero. A dependent variable can therefore have the value zero.
The independent or dependent role comes from how the relationship is being used. A coordinate label by itself names a direction and position; it does not explain a dependence between two quantities.
How can you check a complete coordinate diagram?
A complete check combines the axes, scale, ordered pairs and signs. A neat picture can still have reversed coordinates or an incorrect negative sign. Work from the written data to the diagram, then read the diagram back to the written data.
What should be checked first?
- Check that the axes are perpendicular, correctly named, and marked with a common origin.
- Check that the scale is stated and equal intervals have been marked consistently along each axis.
- Check every point's horizontal coordinate first and its vertical coordinate second, including zero entries.
- Compare each point's signs with its quadrant or axis, and correct any disagreement before joining points.
Joining points means drawing the specified segments between them. A line segment is the part of a straight line between two endpoints. Plot and verify the endpoints first; joining inaccurately plotted points does not correct their coordinates.
How can several points be checked together?
Consider the points R (3, 0), A (0, −2), M (−5, −2) and P (−5, 2), joined in that order. The letters in this task label these particular points. Each point must be interpreted from its own supplied coordinates.
| Point | Coordinate check | Location |
|---|---|---|
| R (3, 0) | Positive x, zero y | Positive x-axis |
| A (0, −2) | Zero x, negative y | Negative y-axis |
| M (−5, −2) | Negative x, negative y | Quadrant III |
| P (−5, 2) | Negative x, positive y | Quadrant II |
A and M have the same y-coordinate, so their joining segment is horizontal. M and P have the same x-coordinate, so their joining segment is vertical. These observations help check the arrangement of plotted points as well as their separate locations.
The horizontal segment from A to M and the vertical segment from M to P meet at a right angle. Here AM means the segment joining A and M, and MP means the segment joining M and P. Shared coordinate values explain their directions.
Use this final check carefully: matching a shared coordinate confirms a direction, but the remaining coordinates are still needed to fix the endpoints. Accurate plotting requires both entries of every ordered pair.
Glossary
- Cartesian system — A system that locates points in a plane using two perpendicular coordinate axes.
- Cartesian plane — The plane containing the coordinate axes, also called the coordinate plane or xy-plane.
- Coordinate axes — The two perpendicular reference lines used to locate points through their coordinates.
- x-axis — The horizontal coordinate axis, with positive positions to the right of the origin.
- y-axis — The vertical coordinate axis, with positive positions above the origin and negative positions below.
- Origin — The intersection of the coordinate axes, labelled O and having coordinates (0, 0).
- Ordered pair — Two numbers in a specified order, giving the horizontal coordinate before the vertical coordinate.
- Abscissa — The x-coordinate of a point, written as the first entry in its ordered pair.
- Ordinate — The y-coordinate of a point, written as the second entry in its ordered pair.
- Quadrant — One of the four regions into which the coordinate axes divide the plane.
- Scale — The relationship between a drawn length and the coordinate units that it represents.
- Plotting — Marking a point's position on a coordinate plane using its given ordered pair.
- Independent variable — A variable whose value is chosen as the input in the relationship being considered.
- Dependent variable — A variable whose value is determined from the chosen input through a specified relationship.
Common errors and misconceptions
- Misconception: Coordinates may be written in either order. Correct: Write x first and y second; interchanging unequal coordinates changes the point.
- Misconception: A negative coordinate describes a negative physical length. Correct: Its sign indicates direction, while distance gives the non-negative size of the separation.
- Misconception: A point with x = 0 is on the x-axis. Correct: It is on the y-axis; points on the x-axis have y = 0.
- Misconception: Every point belongs to a quadrant. Correct: Axis points lie on quadrant boundaries, and the origin is the intersection of both axes.
- Misconception: One coordinate sign is enough to identify a quadrant. Correct: Both signs are required, and zero coordinates must first be checked separately.
- Misconception: Each new point is plotted relative to the previous point. Correct: All coordinates in the same system refer to the same axes and origin.
- Misconception: A decimal coordinate should be rounded before plotting. Correct: Use the scale's subdivisions to retain the given position, including its decimal part.
- Misconception: A correct quadrant guarantees an accurately plotted point. Correct: Check both numerical coordinates and the scale as well as the quadrant.
Exam-style questions with model answers
Q1. Name the horizontal and vertical coordinate axes, and state the coordinates of their intersection. [2 marks]
- The horizontal reference line is called the x-axis, and the vertical reference line is called the y-axis.
- Their intersection is the origin, labelled O, with coordinates (0, 0).
Q2. For Q (−5, 3), state the x-coordinate, the y-coordinate and the quadrant, giving the directional meaning of each coordinate. [3 marks]
- The x-coordinate is −5. This places Q 5 units to the left of the y-axis, because negative horizontal coordinates indicate the leftward direction.
- The y-coordinate is 3. This places Q 3 units above the x-axis, because its vertical coordinate is positive.
- Negative x together with positive y places Q in Quadrant II.
Q3. Locate B (4.5, 0), E (−2.9, 0), H (0, 4) and G (0, −4.5). For each point, give its axis, direction and distance from the origin. [4 marks]
- B lies on the positive x-axis, 4.5 units right of the origin. Its y-coordinate is zero.
- E lies on the negative x-axis, 2.9 units left of the origin. Its y-coordinate is zero.
- H lies on the positive y-axis, 4 units above the origin. Its x-coordinate is zero.
- G lies on the negative y-axis, 4.5 units below the origin. Its x-coordinate is zero.
Q4. Describe how to plot Q (−5, 3) and S (3, −5), using 1 cm = 1 unit on both axes. State each quadrant and explain why the two points differ. [5 marks]
- Draw perpendicular axes, label the horizontal one x and the vertical one y, and mark their intersection O. Use one centimetre for each coordinate unit on both axes.
- For Q, move 5 units left from O and then 3 units up. Mark and label the resulting point Q (−5, 3).
- Q lies in Quadrant II because its x-coordinate is negative while its y-coordinate is positive.
- For S, move 3 units right from O and then 5 units down. Mark S (3, −5) in Quadrant IV.
- The coordinate entries have been interchanged and are unequal. Their horizontal and vertical positions therefore differ, so Q and S are different points.
Q5. Describe the plotting steps for A (3, 4), D (7, 1) and M (9, 6). Explain why their common quadrant alone cannot verify their exact positions. [4 marks]
- Plot A by moving 3 units right from the origin and then 4 units up. Mark its endpoint clearly.
- Plot D by starting again at the origin, moving 7 units right and then 1 unit up.
- Plot M from the same origin by moving 9 units right and then 6 units up.
- All three points are in Quadrant I because their coordinates are positive. Their exact positions still require both specified coordinate values and the correct scale.
Q6. Given R (3, 0), A (0, −2), M (−5, −2) and P (−5, 2), classify each point by axis or quadrant. Then explain why segment AM is horizontal and segment MP is vertical. [6 marks]
- R is on the positive x-axis. Its y-coordinate is zero, while its positive x-coordinate places it right of the origin.
- A is on the negative y-axis. Its x-coordinate is zero, while its negative y-coordinate places it below the origin.
- M lies in Quadrant III because both its horizontal coordinate −5 and its vertical coordinate −2 are negative.
- P lies in Quadrant II because its horizontal coordinate −5 is negative and its vertical coordinate 2 is positive.
- Segment AM is horizontal because A and M have the same y-coordinate, −2, while their x-coordinates differ.
- Segment MP is vertical because M and P have the same x-coordinate, −5, while their y-coordinates differ.
Q7. In the equation 3x + 2y = 12, choose x = 2 and calculate y. Identify the independent and dependent variables for this calculation, and write the resulting ordered pair. [3 marks]
- Here x is the independent variable because its value, 2, is chosen. The value of y is determined from the equation, so y is the dependent variable.
- Substituting x = 2 gives 6 + 2y = 12. Subtracting 6 gives 2y = 6, and dividing by 2 gives y = 3.
- The ordered pair is (2, 3), with the chosen x-value first and the calculated y-value second.
Q8. For coordinates x and y, when do (x, y) and (y, x) represent the same point, and when do they represent different points? [2 marks]
- They represent the same point when x = y, because interchanging equal entries leaves the ordered pair unchanged.
- They represent different points when x ≠ y, because the horizontal and vertical coordinate values are interchanged.
Key takeaways
- The Cartesian system locates points using perpendicular coordinate axes, with their intersection serving as the common origin.
- Write every ordered pair as (x, y), placing the horizontal coordinate before the vertical coordinate.
- Positive coordinates indicate rightward or upward positions, while negative coordinates indicate leftward or downward positions.
- Use both coordinate signs to identify a quadrant, after checking whether either coordinate is zero.
- Points on the x-axis have y = 0; points on the y-axis have x = 0.
- Plot each point from the same origin, retain decimal values, and use the stated scale consistently.
- Check a plotted point by reading its coordinates back from the axes and comparing both values with the question.
- When x is chosen and y is determined from a relationship, the ordered pair records the input before the resulting value.
Test yourself
What does the second coordinate of an ordered pair represent?
It is the y-coordinate, describing vertical position above, below or on the x-axis.
Why is E (−2.9, 0) not in Quadrant III?
Its y-coordinate is zero, so E lies on the negative x-axis rather than inside a quadrant.
Which quadrant contains S (3, −5), and why?
S lies in Quadrant IV because its x-coordinate is positive and its y-coordinate is negative.
What are the coordinates of a point 4 units above O on the y-axis?
The coordinates are (0, 4): horizontal position is zero and vertical position is positive four.
What does the scale 1 cm = 1 unit tell you?
Each centimetre measured on the drawn axis represents one coordinate unit in the chosen system.
Why are (3, −5) and (−5, 3) different ordered pairs?
The entries are unequal and occupy different positions in the two pairs, so their horizontal and vertical coordinates differ.
What do A (0, −2) and M (−5, −2) have in common?
They have the same y-coordinate, −2, so their joining segment is horizontal and below the x-axis.
In 3x + 2y = 12, why is (4, 0) a solution?
Substitution gives three multiplied by four plus two multiplied by zero, which equals twelve as required.
Write about it
Turn a question from this chapter into a paper.
The Writing Studio has a structure guide, a rubric and citation tools for 15 formats, from essays to research papers. Drafting is free with an account. Learnacy Essential adds feedback from an AI writing coach and submission to The OYI Review.
Learnacy Essential is ₹1,499 for the year. Publication depends on review and is not guaranteed.