
Elasticity of Demand | ISC Class 12 Economics Notes
On this page
Watch & explore
Start with a few high-quality watches, then dive into the notes below.
Try an idea before you read. Test your understanding of elasticity of demand with this 2-step scenario: Explore →

Learnacy Labs Try it hands-on: open the Markets lab
This note covers the meaning and types of elasticity of demand, degrees of price elasticity, percentage calculations, geometric measurement, expenditure and elasticity, constant-elasticity demand curves, determinants of price elasticity, income elasticity and cross elasticity.
What does elasticity of demand measure?
Demand refers here to the quantity of a good a consumer chooses at a given price, with income, prices of other goods, and tastes and preferences given. A demand curve shows the quantities chosen at different prices under these conditions.
The law of demand describes the inverse relationship between price and quantity demanded, other things remaining the same. Elasticity measures the responsiveness involved in that relationship. Some quantities change considerably following small price changes; others respond much less.
Definition: Price elasticity of demand is the percentage change in quantity demanded divided by the percentage change in the good's own price.
Which change is being measured?
For price elasticity, the changing influence is the good's own price. The consumer's income, the prices of other goods and preferences remain unchanged. This isolates a movement along a demand curve, rather than a shift caused by another influence.
Income elasticity measures the response of quantity demanded to a change in consumer income. Cross elasticity measures the response of demand for one good to a change in another good's price. The denominator identifies which influence is changing.
| Type | Quantity response measured | Changing influence |
|---|---|---|
| Price elasticity | Demand for the good | Its own price |
| Income elasticity | Demand for the good | Consumer income |
| Cross elasticity | Demand for one good | Price of a related good |
These measures answer different questions. A consumer may buy less tea because tea becomes dearer, because income changes, or because coffee becomes cheaper. The own-price, income and cross measures keep these separate influences distinct.
A statement that demand falls therefore does not, by itself, identify an elasticity. Establish which variable changed and compare the relevant percentage changes. The direction of a response and the size of a response are related but distinct parts of the explanation.
How is price elasticity calculated by the percentage method?
Let P denote the original price and Q the original quantity demanded. The symbol Δ, read as delta, means change. Thus ΔP is the new price minus the original price, and ΔQ is the new quantity minus the original quantity.
Let eD denote signed price elasticity. Signed means that a positive or negative sign is retained. The symbol |eD| denotes its absolute value, or magnitude without the negative sign.
eD = (ΔQ/Q) ÷ (ΔP/P)
eD = (ΔQ/ΔP) × (P/Q)
Multiplying each fractional change by 100 gives the two percentage changes. The factors of 100 cancel when one percentage is divided by the other. Elasticity is therefore a pure number, rather than an amount measured in rupees or physical units.
How should the calculation be organised?
- Record the original price and quantity and the new price and quantity, keeping each price paired with its corresponding quantity.
- Subtract the original quantity from the new quantity. Divide that change by the original quantity and multiply by 100.
- Subtract the original price from the new price. Divide that change by the original price and multiply by 100.
- Divide the percentage quantity change by the percentage price change. Interpret the sign separately from the magnitude.
For a downward-sloping demand curve, a price increase is associated with a quantity decrease. One change is positive and the other negative, so signed elasticity is negative. Classification as elastic or inelastic normally uses the absolute value.
Note: Use the original value as the base for each percentage in this method. Dividing a quantity change by a price change alone gives a rate of change, not the complete elasticity measure.
Retain the distinction between a fall in quantity and a negative elasticity. The negative sign records the inverse relationship. It does not indicate that demand is inelastic: that conclusion depends on whether the magnitude is below one.
How do the numerical examples apply the percentage method?
What happens when the price of bananas rises?
Worked example 1. A consumer buys 15 bananas at Rs. 5 per banana. When the price rises to Rs. 7 per banana, quantity demanded falls to 12 bananas. Calculate price elasticity using the original values as bases.
Answer: Quantity change = 12 − 15 = −3 bananas. Percentage quantity change = (−3/15) × 100 = −20%. Price change = Rs. 7 − Rs. 5 = Rs. 2. Percentage price change = (2/5) × 100 = 40%.
Signed elasticity = −20/40 = −0.5. Its magnitude is 0.5, so demand is inelastic at the stated price base. Quantity responds proportionately less than price.
| Banana example | Price per banana | Quantity demanded |
|---|---|---|
| Original position | Rs. 5 | 15 bananas |
| New position | Rs. 7 | 12 bananas |
| Percentage change | 40% increase | 20% decrease |
How does a second pair of observations compare?
Worked example 2. At Rs. 4, demand for a good is 25 units. When its price increases to Rs. 5, demand falls to 20 units. Calculate price elasticity using the original price and quantity.
Answer: Percentage quantity change = [(20 − 25)/25] × 100 = −20%. Percentage price change = [(5 − 4)/4] × 100 = 25%. Signed elasticity = −20/25 = −0.8; its magnitude is 0.8. Demand is inelastic.
Both examples have a 20% quantity decline, but their price increases differ. Consequently, their elasticities differ. A percentage quantity change cannot establish responsiveness until it is compared with the percentage change in price.
Can elasticity be used to find a missing percentage?
Worked example 3. Signed price elasticity is −0.2 and the price of the good increases by 5%. Find the percentage change in quantity demanded.
Answer: Percentage quantity change = elasticity × percentage price change = −0.2 × 5% = −1%. Quantity demanded falls by 1%. An original quantity is unnecessary because the required answer is a percentage.
This rearrangement uses the same relationship as the first two examples. The negative result must be stated as a decrease. It does not mean a reduction of one physical unit, since no original quantity has been specified.
What are the five degrees of price elasticity of demand?
The degree of elasticity expresses how strongly quantity responds to price. Compare the magnitudes of the percentage changes, then identify whether the elasticity is zero, below one, equal to one, above one or infinite.
| Degree | Magnitude | Meaning |
|---|---|---|
| Perfectly inelastic | |eD| = 0 | Quantity remains unchanged when price changes. |
| Relatively inelastic | 0 < |eD| < 1 | The percentage quantity response is smaller than the percentage price change. |
| Unitary elastic | |eD| = 1 | The percentage responses have equal magnitudes at the point considered. |
| Relatively elastic | |eD| > 1 | The percentage quantity response is larger than the percentage price change. |
| Perfectly elastic | |eD| = ∞ | The limiting case represented by a horizontal demand curve. |
The symbol ∞ means infinity. A perfectly inelastic demand curve is vertical: the quantity stays fixed across different prices. A perfectly elastic demand curve is horizontal: different quantities lie at the same price.
How are ordinary elasticity and the extreme cases different?
Inelastic demand need not mean no quantity response. The banana example has a definite fall in quantity, yet the fall is proportionately smaller than the price rise. No quantity response is the special case of perfectly inelastic demand.
Elastic demand means a more than proportionate quantity response. It should not be confused with the perfectly elastic limiting case. Similarly, a quantity response of the same percentage magnitude gives unitary elasticity, rather than zero elasticity.
A necessity is a good essential for life; a luxury is a good beyond basic necessities. Demand for essential goods is often found to be inelastic. Demand for a luxury good is likely to be price elastic. These statements describe tendencies and do not assign a fixed elasticity to every essential or luxury good.
A good's demand may be elastic, unitary elastic and inelastic at different prices. Therefore, state the point or price base when interpreting a calculated elasticity. A single value need not describe every position on the demand curve.
How is elasticity measured geometrically on a straight demand curve?
Point elasticity measures responsiveness at a particular price-quantity position. The geometric method measures it by comparing the two segments of a straight demand curve. The lower segment runs from the selected point to the quantity axis; the upper segment runs from that point to the price axis.
Let B be the intercept where the curve meets the vertical price axis, A the intercept on the horizontal quantity axis, and D the selected point between them. A segment such as DA means the length along the straight line joining D and A.
Magnitude of elasticity = DA/DB
This is the lower-segment/upper-segment rule. Measure both lengths along the demand curve. Reversing the ratio would reverse the interpretation of the upper and lower parts of the curve.
How does the ratio change along the line?
- Draw a straight downward-sloping demand curve meeting the price axis at B and the quantity axis at A.
- Choose a point D between the intercepts and identify the lower segment DA and the upper segment DB.
- Compare the lower segment with the upper segment, using their lengths along the same straight demand curve.
- Classify demand as elastic, unitary elastic or inelastic according to whether the ratio exceeds, equals or falls below one.
At the midpoint, the two segments are equal, so elasticity has magnitude one. Above the midpoint, the lower segment is longer, so elasticity exceeds one. Below the midpoint, the lower segment is shorter, so elasticity is below one.
Diagram
Geometric measurement of elasticity
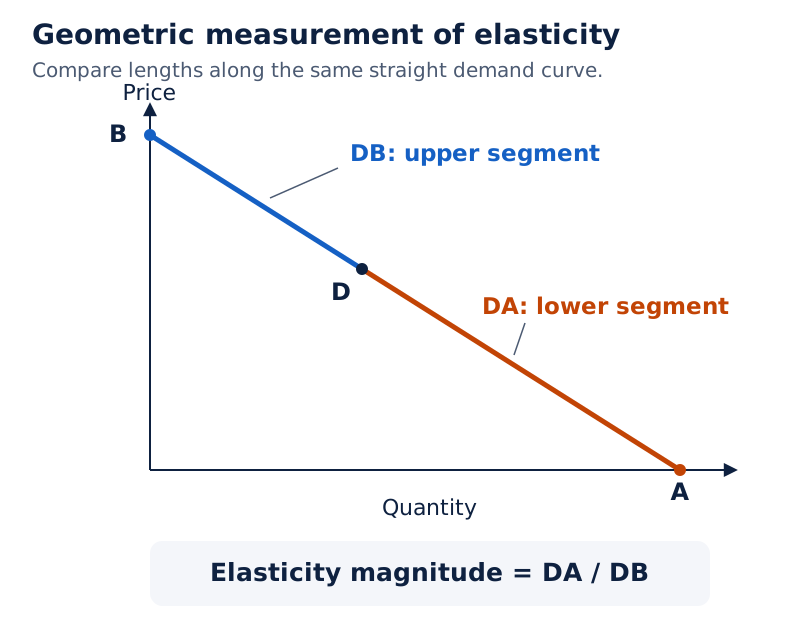
Put price on the vertical axis and quantity on the horizontal axis. Join price intercept B to quantity intercept A. Mark point D on BA and label DA as the lower segment and DB as the upper segment.
Drawn by One Young India.
At the quantity-axis intercept, the lower segment is zero and elasticity is zero. At the price-axis intercept, the upper segment tends to zero and elasticity tends to infinity. These endpoint results describe the limits of the same segment relationship.
Why does elasticity vary along a linear demand curve?
A linear demand curve is a straight demand curve. Write its demand equation as q = a − bp, where q denotes quantity demanded, p denotes price, a is the quantity demanded at zero price, and b is the positive quantity reduction per unit price rise.
Here a and b are constants, values held fixed in this equation. The relevant downward-sloping segment extends from quantity a at zero price to zero quantity at price a/b. The expression a/b means a divided by b.
Along this line, the quantity change per unit price change, Δq/Δp, equals −b. Substitution into the percentage formula gives signed elasticity:
eD = −bp/q
Since q equals a − bp, the same expression can also be written as eD = −bp/(a − bp). Although b stays constant, the ratio of price to quantity changes along the line. Elasticity therefore changes too.
What does the graph show?
What the figure shows
Elasticity along a linear demand curve
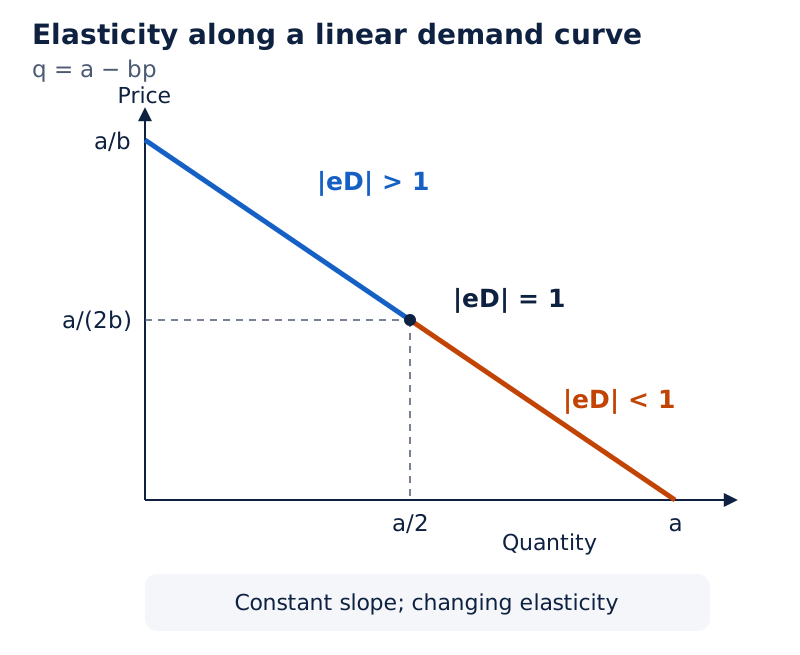
Price is vertical and quantity horizontal. The line joins price a/b to quantity a. At its midpoint, price is a/(2b), quantity is a/2 and elasticity has magnitude one. Labels show elasticity above one on the upper portion and below one on the lower portion.
Drawn by One Young India.
The expression a/(2b) means a divided by twice b. The midpoint price and midpoint quantity identify the same position on the straight line. They do not define two separate points of unitary elasticity.
| Position | Price and quantity relationship | Elasticity magnitude |
|---|---|---|
| Price-axis end | Quantity tends to zero | Tends to infinity |
| Upper half | Above the midpoint price | Greater than one |
| Midpoint | Price a/(2b), quantity a/2 | One |
| Lower half | Below the midpoint price | Less than one |
| Quantity-axis end | Price is zero | Zero |
Slope measures a rate of change in the quantities plotted on a graph. Elasticity compares proportionate changes. A straight line has a constant slope, but this does not give it constant elasticity: the price-to-quantity factor must also be included.
Which demand curves have constant elasticity?
Constant elasticity means that the elasticity has the same value at different points on a demand curve. A downward-sloping straight line does not have this property. The vertical, horizontal and unitary-elastic curves illustrate three distinct constant-elasticity cases.
A rectangular hyperbola is a curve on which the product of the two variables is constant.
What the figure shows
Constant-elasticity demand curves
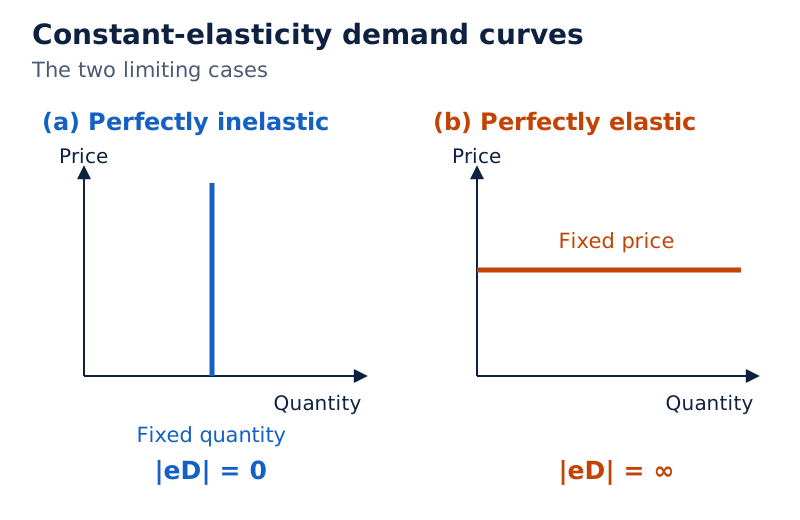
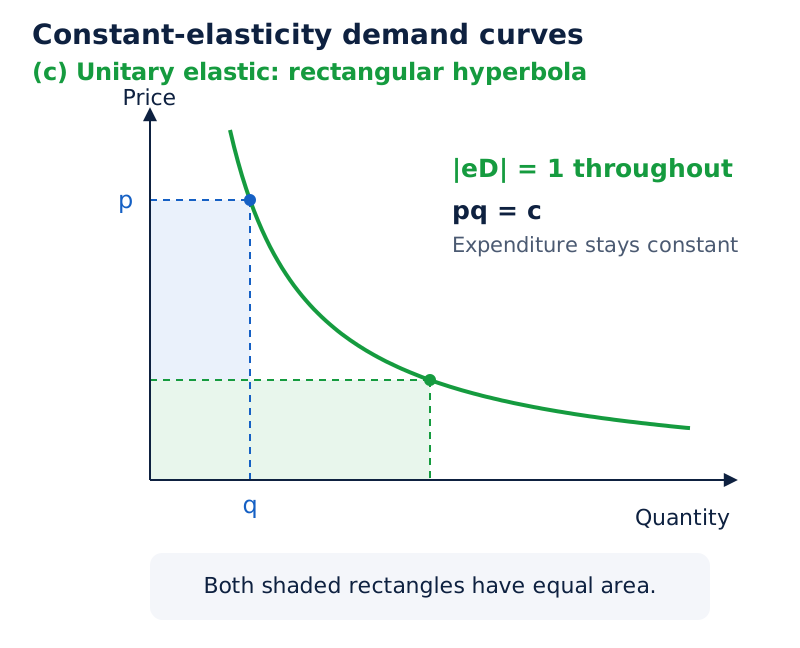
Each panel has price on the vertical axis and quantity on the horizontal axis. Panel (a) contains a vertical line at a fixed quantity. Panel (b) contains a horizontal line at a fixed price. Panel (c) contains a downward-curving rectangular hyperbola with price and quantity projections.
Drawn by One Young India.
For the vertical curve, price changes leave quantity unchanged, so elasticity is zero. The horizontal curve represents perfectly elastic demand, with infinite elasticity. These are limiting cases, not alternative drawings of an ordinary downward-sloping straight line.
What is special about a rectangular hyperbola?
For a rectangular hyperbola representing demand, write pq = c, where p is price, q is quantity and c is a positive constant representing expenditure.
Moving along this curve changes price and quantity while keeping their product unchanged. Its point elasticity has magnitude one throughout. By contrast, a straight downward-sloping demand curve has unitary elasticity at its midpoint alone.
For any selected point, multiplying its price coordinate by its quantity coordinate gives the area of the rectangle between that point and the axes. On the rectangular hyperbola, the rectangles associated with different points have equal areas because the product remains constant.
This area interpretation connects the curve to spending. A consumer can occupy different price-quantity positions on the curve while expenditure remains the same. A downward slope alone does not establish this property; the constant-product relationship is essential.
Note: Equal percentage changes describe unitary point elasticity locally. For a finite price change, use the constant product pq to test exact expenditure rather than assuming equal original-base percentage changes cancel exactly.
How does price elasticity affect total expenditure?
Total expenditure on a good is the amount spent on the quantity purchased. Let E denote this expenditure. With price p and quantity q, the relationship is E = pq. Price and quantity can move in opposite directions, so both changes matter.
What does the expenditure method identify?
The expenditure method relates the direction of the spending change to the direction of the price change. For small changes, elastic demand gives opposite movements in price and spending, while inelastic demand gives movements in the same direction.
First-order change means the change calculated after omitting the product of the small price and quantity changes. Expenditure is exactly constant along a unitary-elastic rectangular hyperbola. At an isolated unitary point, the table describes the local relationship.
| Elasticity magnitude | When price rises | When price falls |
|---|---|---|
| Greater than one | Expenditure falls | Expenditure rises |
| Less than one | Expenditure rises | Expenditure falls |
| Equal to one | No first-order expenditure change | No first-order expenditure change |
Why must the small-change condition be retained?
Let ΔE denote new expenditure minus original expenditure. The new price is p + Δp and the new quantity is q + Δq. Multiplying these and subtracting the original product gives the exact expression:
ΔE = qΔp + pΔq + ΔpΔq
For small values of Δp and Δq, their product is negligible. The expenditure change is then approximately qΔp + pΔq. The word approximately matters: dropping the product term is an approximation, not an exact rule for every finite change.
The expenditure method classifies responsiveness without necessarily supplying an exact elasticity coefficient. When actual prices and quantities are available, compare their products to establish the exact spending change. Use the percentage formula separately to calculate the requested coefficient.
A spending factor means new expenditure divided by old expenditure.
Worked example 4. Signed price elasticity is −0.2. The good's price increases by 10%. Determine the percentage quantity response and explain the direction of the expenditure change.
Answer: Percentage quantity change = −0.2 × 10% = −2%. Demand is inelastic because the elasticity magnitude is 0.2. Expenditure increases. Treating the stated percentages as finite original-base changes, the new spending factor is 1.10 × 0.98 = 1.078, an increase of 7.8%.
The factors 1.10 and 0.98 mean 110% of the original price and 98% of the original quantity. Their product includes both changes, so it avoids confusing an approximate result with an exact multiplication.
What factors determine price elasticity of demand?
The nature of the good and the availability of close substitutes help explain why some demands respond more strongly to price than others. A substitute is a good that can be consumed in place of another good.
How do necessities and luxuries differ?
A necessity is a good essential for life, such as food. Demand for food does not change much even if its price rises. In general, demand for a necessity is likely to be price inelastic.
A luxury is a good considered beyond basic necessities. Demand for luxuries can be very responsive to price changes. In general, demand for a luxury good is likely to be price elastic.
These tendencies concern responsiveness, not whether quantity changes at all. Relatively inelastic demand still permits a quantity response. Likewise, describing a good as a luxury does not by itself supply a numerical elasticity for a particular consumer or price.
Why do close substitutes matter?
Close substitutes provide readily usable alternatives. When the price of a particular variety of pulses rises, consumers can shift to another variety. Consequently, demand for a specific food item is likely to be more elastic than demand for food considered broadly.
The distinction between food as a broad category and one variety of pulses is important. A consumer cannot replace the need for food simply by choosing another food item. However, choosing another variety can reduce demand for the particular variety whose price has increased.
| Condition | Likely response | Reason |
|---|---|---|
| Necessity such as food | Relatively inelastic demand | Consumption fulfils an essential need. |
| Close substitutes easily available | Relatively elastic demand | Consumers can shift to alternatives. |
| Close substitutes not easily available | Relatively inelastic demand | Switching is less readily possible. |
The demand for a good is likely to be elastic when close substitutes are easily available and likely to be inelastic when they are not. Keep these qualifications when explaining the relationship; availability supports a tendency, not a universal numerical rule.
How do income elasticity and cross elasticity differ?
Own-price elasticity holds other influences given. Income and cross elasticity instead focus on two of those other influences. They explain changes in demand associated with income or related prices, while keeping the remaining relevant conditions unchanged.
What does income elasticity measure?
Let Y denote consumer income, ΔY its change, and eY income elasticity. Using Q for the original quantity of the good and ΔQ for its change:
eY = (ΔQ/Q) ÷ (ΔY/Y)
A normal good has demand that moves in the same direction as income, giving positive income elasticity. For most goods, the quantity chosen increases as income increases and decreases as income decreases.
An inferior good has demand that moves in the opposite direction to income, giving negative income elasticity. Low-quality food items such as coarse cereals provide an example. The classification concerns how demand responds to income.
A good can be normal for a consumer at some income levels and inferior at others. At very low incomes, demand for low-quality cereals can increase with income. Beyond a level, further income increases are likely to reduce consumption as the consumer switches to better-quality cereals.
What does cross elasticity measure?
Use X and Z as labels for two different goods. Let QX denote the original quantity demanded of X and PZ the original price of Z. ΔQX and ΔPZ denote their respective changes; eXZ denotes cross elasticity.
eXZ = (ΔQX/QX) ÷ (ΔPZ/PZ)
For substitutes such as tea and coffee, demand for one good usually moves in the direction of the other's price. If coffee becomes dearer, consumption of tea is likely to rise. The associated cross elasticity is positive.
Complementary goods are consumed together, such as tea and sugar, shoes and socks, or pen and ink. An increase in sugar's price is likely to decrease demand for tea. The associated cross elasticity is negative.
| Measure | Positive sign | Negative sign |
|---|---|---|
| Income elasticity | Normal-good relationship | Inferior-good relationship |
| Cross elasticity | Substitute relationship | Complementary relationship |
Retain these signs because they identify the relationship being measured. The convention of using an absolute value to classify own-price responsiveness should not erase the difference between normal and inferior goods, or between substitutes and complements.
Glossary
- Price elasticity of demand — The percentage change in quantity demanded divided by the percentage change in the good's own price.
- Percentage method — Calculation of elasticity by comparing proportionate quantity and price changes using the stated original values.
- Absolute value — The magnitude of a number without its positive or negative sign.
- Inelastic demand — Demand whose percentage quantity response is smaller than the percentage price change in magnitude.
- Elastic demand — Demand whose percentage quantity response exceeds the percentage price change in magnitude.
- Unitary elasticity — Price elasticity with magnitude one, indicating equal proportionate responses at the point being considered.
- Perfectly inelastic demand — Demand with zero price elasticity, represented by a vertical demand curve at a fixed quantity.
- Perfectly elastic demand — The limiting case of infinite price elasticity represented by a horizontal demand curve.
- Geometric method — Measurement of point elasticity using the lower segment divided by the upper segment of a straight demand curve.
- Total expenditure — The amount spent on a good, calculated by multiplying its price by the quantity purchased.
- Rectangular hyperbola — A curve on which the product of the two variables remains constant at every point.
- Income elasticity — The percentage change in quantity demanded divided by the percentage change in consumer income.
- Cross elasticity — The percentage change in demand for one good divided by the percentage change in another good's price.
- Substitutes — Goods that can replace one another in consumption, such as tea and coffee.
- Complements — Goods consumed together, so demand for one generally moves oppositely to the other's price.
Common errors and misconceptions
- Misconception: Inelastic demand means quantity cannot change. Correct: Relatively inelastic demand has a smaller proportionate quantity response; zero response describes perfectly inelastic demand.
- Misconception: A negative coefficient must be less elastic than a positive number. Correct: The negative sign records the inverse own-price relationship. Compare absolute values when classifying price responsiveness.
- Misconception: Dividing the quantity change by the price change gives elasticity. Correct: The calculation must also multiply by the original price-to-quantity ratio, or directly divide the two percentage changes.
- Misconception: A straight demand curve has constant elasticity. Correct: Its slope is constant, but elasticity varies because the price-to-quantity ratio changes along the curve.
- Misconception: The geometric formula is upper segment divided by lower segment. Correct: It is lower segment divided by upper segment; equal segments give unitary elasticity.
- Misconception: A price rise necessarily increases expenditure. Correct: Quantity also responds. For small changes with elastic demand, expenditure falls when price rises.
- Misconception: Equal finite percentage increases and decreases cancel exactly in expenditure. Correct: Multiply the new price and quantity factors. The small-change approximation omits their product term.
- Misconception: The signs of income and cross elasticity can be discarded. Correct: They distinguish normal from inferior goods and substitutes from complements.
Exam-style questions with model answers
Q1. Define price elasticity of demand and explain why it is a pure number. [2 marks]
- Price elasticity of demand is the percentage change in quantity demanded divided by the percentage change in the good's own price, other influences remaining unchanged.
- Both changes are measured as percentages. Their ratio therefore has no physical or monetary unit and is a pure number.
Q2. A consumer buys 15 bananas at Rs. 5 each and 12 bananas at Rs. 7 each. Using original values as bases, calculate price elasticity and classify demand. [4 marks]
- The quantity change is 12 − 15 = −3 bananas. Using the original quantity of 15 bananas, percentage quantity change is (−3/15) × 100 = −20%.
- The price change is Rs. 7 − Rs. 5 = Rs. 2. Using the original price of Rs. 5, percentage price change is (2/5) × 100 = 40%.
- Signed price elasticity is the percentage quantity change divided by the percentage price change: −20/40 = −0.5.
- The absolute value is 0.5, below one. Demand is inelastic because the percentage quantity decline is smaller than the percentage price increase.
Q3. A good's price rises from Rs. 4 to Rs. 5 and quantity demanded falls from 25 units to 20 units. Use the original values to calculate and interpret price elasticity. [3 marks]
- The quantity decline is 20 − 25 = −5 units. The percentage quantity change, based on 25 units, is (−5/25) × 100 = −20%.
- The price increase is Rs. 5 − Rs. 4 = Rs. 1. The percentage price change, based on Rs. 4, is (1/4) × 100 = 25%.
- Signed elasticity is −20/25 = −0.8. Its magnitude is 0.8, so demand is inelastic: quantity changes proportionately less than price.
Q4. A straight demand curve joins B on the price axis to A on the quantity axis. D is a point on BA. Explain geometric measurement and the elasticity at the midpoint, above it and below it. [5 marks]
- The geometric method measures the magnitude of price elasticity at a selected point on a straight demand curve. Here D is the point at which responsiveness is to be measured.
- The magnitude equals DA/DB. DA is the lower segment from D to the quantity-axis intercept; DB is the upper segment from D to the price-axis intercept.
- At the midpoint, DA and DB are equal. Their ratio is one, so demand is unitary elastic at this point.
- Above the midpoint, the lower segment DA is longer than the upper segment DB. The ratio exceeds one and demand is elastic.
- Below the midpoint, DA is shorter than DB. The ratio is below one and demand is inelastic, despite the unchanged slope of the straight curve.
Q5. Explain how the nature of a good and the availability of close substitutes affect price elasticity, using food and varieties of pulses as examples. [4 marks]
- Food is a necessity essential for life. Demand does not change much when food prices rise, so demand for a necessity is generally likely to be price inelastic.
- Demand for luxuries can be very responsive to price changes. Demand for a luxury good is generally likely to be price elastic.
- If one variety of pulses becomes dearer, consumers can shift to another variety that is a close substitute. Demand for the particular variety is therefore likely to be more elastic.
- Close substitutes make switching easier and demand is likely to be elastic. Where close substitutes are not easily available, demand is likely to be inelastic.
Q6. Signed price elasticity is −0.2 and price rises by 5%. Calculate the percentage change in quantity demanded. [2 marks]
- Percentage quantity change equals signed elasticity multiplied by percentage price change: −0.2 × 5% = −1%.
- Quantity demanded falls by 1%. The negative sign indicates that quantity moves oppositely to the price increase.
Q7. Distinguish income elasticity from cross elasticity. Explain the relevant signs using normal and inferior goods, tea and coffee, and tea and sugar. [6 marks]
- Income elasticity compares the percentage change in quantity demanded with the percentage change in consumer income, while other relevant conditions remain unchanged.
- For a normal good, demand moves in the same direction as income. Income elasticity is positive because the quantity and income changes have the same sign.
- For an inferior good, demand moves oppositely to income, giving negative income elasticity. Low-quality food items such as coarse cereals illustrate this relationship.
- Cross elasticity compares the percentage quantity change for one good with the percentage price change for another good, keeping other relevant conditions unchanged.
- Tea and coffee are substitutes. A rise in coffee's price is likely to raise tea consumption. This same-direction relationship gives positive cross elasticity.
- Tea and sugar are complements consumed together. A rise in sugar's price is likely to reduce demand for tea. This opposite-direction relationship gives negative cross elasticity.
Q8. Explain the relationship between price elasticity and expenditure for small price changes. Include the qualification needed when applying this relationship to finite changes. [4 marks]
- Expenditure equals price multiplied by quantity purchased. With elastic demand, its local change is opposite to the price change: a price rise reduces expenditure and a price fall increases it.
- With inelastic demand, expenditure locally moves in the same direction as price. A price rise increases expenditure and a price fall decreases it.
- At unitary elasticity there is no first-order expenditure change. Expenditure is exactly constant along a demand curve that is a rectangular hyperbola.
- The small-change calculation neglects the product of the price and quantity changes. For finite changes, multiply actual new price and new quantity to determine exact expenditure.
Key takeaways
- Price elasticity compares percentage quantity and price changes, measuring responsiveness while other influences on demand remain unchanged.
- Use the original price and quantity as the percentage bases, then interpret the signed coefficient and its magnitude separately.
- Inelastic demand permits quantity changes; perfectly inelastic demand is the special case of no response to price changes.
- On a straight demand curve, geometric elasticity equals the lower segment divided by the upper segment.
- Elasticity varies along a straight demand curve even though its slope remains constant throughout that line.
- Expenditure equals price times quantity; the usual elasticity relationship describes small changes, while exact finite changes require multiplying the actual values.
- Necessities are likely to have inelastic demand, while easily available close substitutes are likely to make demand more elastic.
- Income elasticity distinguishes normal from inferior goods; cross elasticity distinguishes substitute from complementary relationships through their signs.
Test yourself
Why is dividing the change in quantity by the change in price insufficient?
Elasticity compares percentage changes. The quantity-change to price-change ratio must also be multiplied by the original price divided by the original quantity.
What does a price elasticity magnitude of 0.5 indicate?
Demand is inelastic. The percentage quantity response is smaller than the percentage price change; it does not mean quantity is unchanged.
Where is elasticity equal to one on a straight downward-sloping demand curve?
At the midpoint between the two intercepts, because the lower and upper segments of the demand curve have equal lengths.
How can a curved demand curve have unitary elasticity throughout?
A rectangular hyperbola keeps price multiplied by quantity constant. Its point elasticity has magnitude one at every position on the curve.
Why can demand for one variety of pulses be more elastic than demand for food?
Consumers can replace one variety with another close substitute. Switching between food items does not remove the essential need for food itself.
Price falls by 4% and expenditure rises by 2%. What elasticity category does this indicate?
Demand is elastic. Price and expenditure move in opposite directions, with the quantity increase more than offsetting the effect of the price decline.
Why must income elasticity retain its positive or negative sign?
A positive sign identifies demand moving with income, as for a normal good; a negative sign identifies an inferior-good relationship.
What cross-elasticity relationship is illustrated by tea and sugar?
They are complements consumed together. A sugar price increase is likely to reduce tea demand, giving a negative cross-elasticity relationship.
Try it
Mastering Elasticity of Demand
Test your understanding of elasticity of demand with this 2-step scenario:
1What does the concept of elasticity of demand measure?
The Law of Demand tells us the direction of the relationship between price and quantity demanded, but elasticity measures the magnitude of this relationship.
Elasticity of demand measures how much a change in price affects the quantity demanded, assuming all other factors remain constant.
While the availability of close substitutes is a determinant of price elasticity, it is not what the concept of elasticity itself measures.
2Which of the following goods is likely to have relatively inelastic demand?
Luxury cars have many substitutes and are not essential, so their demand is likely to be relatively elastic.
Insulin is a necessity with no close substitutes, so its demand is likely to be relatively inelastic.
A daily newspaper is a habit-forming good, but it is not essential, and its demand may be relatively elastic.
3What is the formula for measuring price elasticity of demand using the Percentage Method?
This is the correct formula for the Percentage Method.
This formula is incorrect. The correct formula is Ep = (Change in Quantity / Original Quantity) × (Original Price / Change in Price)
This formula is for the Geometric Method, not the Percentage Method.
4What happens to the elasticity of demand as you move down a linear demand curve towards the quantity axis?
As you move down a linear demand curve towards the quantity axis, the lower segment shrinks and the upper segment grows, causing elasticity to decrease.
Elasticity changes as you move down a linear demand curve towards the quantity axis.
As you move down a linear demand curve towards the quantity axis, the lower segment shrinks and the upper segment grows, causing elasticity to decrease from infinity to zero.
We hope this scenario has helped you understand the concept of elasticity of demand. Remember to practice applying these concepts to different scenarios to reinforce your learning.