
Index Numbers | CBSE Class 11 Economics Notes
On this page

This note covers the meaning of index numbers, base periods, simple and weighted methods, price relatives, consumer and wholesale prices, industrial production, inflation, purchasing power, real wages, construction problems and the uses of indices in economic analysis.
What is an index number, and why is it useful?
Definition: An index number is a statistical measure of average change in a group of related variables across two situations. It summarises their different individual changes in a single figure.
A variable is a quantity whose value can change, such as price or production. Prices of different commodities may move differently: some rise while others fall. Listing every change becomes difficult to interpret when many commodities are involved.
An index number brings these movements together. It can describe changes in prices, the physical volume of production, agricultural output or the cost of living. The individual changes need not be identical for a summary measure to be useful.
What does the base period mean?
The base period is the period against which comparison is made. Its index is conventionally set at 100. The current period is the period being compared with that base. Indices are conventionally expressed in percentage terms.
For a comparison of prices in 2005 with prices in 1990, 1990 is the base. An index of 250 means the measured value is two and a half times its base-period value. The base supplies the reference needed to interpret the number.
How do price and quantity indices differ?
A price index measures changes in prices of specified goods. A quantity index measures changes in physical quantities, such as production, construction or employment. Price index numbers are more widely used, but a production index is also an important indicator of economic output.
Keep the object of comparison clear. A change in the money value of a basket and a change in its physical quantity are different questions. Choosing an index begins with deciding which question the comparison should answer.
How is a simple aggregative price index calculated?
The aggregative method combines prices by adding them. In its simple form, it compares the sum of current-period prices with the sum of base-period prices. The following prices are in rupees, abbreviated as Rs.
| Commodity | Base-period price (Rs) | Current-period price (Rs) | Percentage change |
|---|---|---|---|
| A | 2 | 4 | 100 |
| B | 5 | 6 | 20 |
| C | 4 | 5 | 25 |
| D | 2 | 3 | 50 |
Let P₀ mean the base-period price of a commodity, P₁ its current-period price and P₀₁ the price index comparing period 1 with period 0. The symbol Σ means the sum across all included commodities. The symbol × means multiplication.
P₀₁ = (ΣP₁ / ΣP₀) × 100
Worked example 1. Calculate the simple aggregative price index for commodities A, B, C and D using the prices in the table.
Answer: P₀₁ = [(4 + 6 + 5 + 3) / (2 + 5 + 4 + 2)] × 100 = 138.5, rounded to one decimal place. Prices have risen by 38.5 per cent.
What are the calculation steps?
- Add the current-period prices of all included commodities.
- Add the base-period prices of those same commodities.
- Divide the current-period sum by the base-period sum and multiply by 100.
- Interpret the resulting index against the base value of 100.
The four percentage changes differ substantially. The index provides one summary, instead of requiring a separate statement for every commodity. It does not mean that each price rose by the same percentage.
This index has limited use. The units in which prices are quoted may differ across commodities, and their relative importance is not properly reflected. Food items occupy a large proportion of expenditure, so giving all items equal importance may be unsuitable.
How do Laspeyre’s and Paasche’s weighted indices differ?
A weighted index takes account of the relative importance of items. A weight represents that importance in the calculation. In a weighted aggregative price index, quantities serve as weights and specify the basket whose cost is compared.
A basket is a specified collection of goods in stated quantities. Holding the basket fixed permits its value to change because of prices. Different weighted methods can choose baskets from different periods.
Let q₀ denote the base-period quantity and q₁ the current-period quantity of each commodity. Prices and quantities for the calculation are:
| Commodity | P₀ | q₀ | P₁ | q₁ |
|---|---|---|---|---|
| A | 2 | 10 | 4 | 5 |
| B | 5 | 12 | 6 | 10 |
| C | 4 | 20 | 5 | 15 |
| D | 2 | 15 | 3 | 10 |
What basket does Laspeyre’s index use?
Laspeyre’s price index uses base-period quantities as weights. It asks how much the original basket costs at current prices relative to its cost at base-period prices.
P₀₁ = (ΣP₁q₀ / ΣP₀q₀) × 100
Worked example 2. Find Laspeyre’s price index from the table, with prices in Rs and base-period quantities as weights.
Answer: The current cost of the base basket is 4 × 10 + 6 × 12 + 5 × 20 + 3 × 15 = Rs 257. Its base cost is 2 × 10 + 5 × 12 + 4 × 20 + 2 × 15 = Rs 190. The index is (257 / 190) × 100 = 135.3, rounded. Prices have risen by 35.3 per cent.
What basket does Paasche’s index use?
Paasche’s price index uses current-period quantities as weights. It compares the current basket at current prices with the cost of that same basket at base-period prices.
P₀₁ = (ΣP₁q₁ / ΣP₀q₁) × 100
Worked example 3. Find Paasche’s price index from the same table, using current-period quantities as weights.
Answer: The current basket costs 4 × 5 + 6 × 10 + 5 × 15 + 3 × 10 = Rs 185 at current prices. At base prices it costs 2 × 5 + 5 × 10 + 4 × 15 + 2 × 10 = Rs 140. The index is (185 / 140) × 100 = 132.1, rounded, indicating a price rise of 32.1 per cent.
The difference between these formulae is the choice of weights. Both compare prices, but they hold different baskets fixed. Their results should therefore be interpreted with reference to the quantities used.
How does the method of averaging price relatives work?
A price relative compares one commodity’s current price with its base price, usually in percentage terms. Let R denote this price relative. Dividing the current price by the base price gives the ratio; multiplying by 100 expresses it relative to a base of 100.
R = (P₁ / P₀) × 100
The simple average of price relatives is their arithmetic mean: add the relatives and divide by their number. Let n denote the number of commodities.
P₀₁ = ΣR / n
For A, B, C and D above, the relatives are 200, 120, 125 and 150. Their simple average gives an index of 149 when rounded to a whole number, indicating a rise of 49 per cent on that rounding.
How are expenditure weights used?
In a weighted average of price relatives, each relative is multiplied by its weight. Let W denote a commodity’s weight and WR the product of its weight and price relative. Divide the sum of these products by the sum of weights.
P₀₁ = ΣWR / ΣW
| Commodity | Weight in % | Base price (Rs) | Current price (Rs) | Price relative |
|---|---|---|---|---|
| A | 40 | 2 | 4 | 200 |
| B | 30 | 5 | 6 | 120 |
| C | 20 | 4 | 5 | 125 |
| D | 10 | 2 | 3 | 150 |
Worked example 4. Use the stated expenditure weights and price relatives to calculate the weighted price index.
Answer: P₀₁ = (40 × 200 + 30 × 120 + 20 × 125 + 10 × 150) / 100 = 156. Prices have risen by 56 per cent. The largest weight belongs to A, whose price has doubled.
Weights may represent each item’s share of total expenditure. Depending on the formula, they may relate to the base or current period. In general, base-period weights are preferred because recalculating weights each year is inconvenient and changing baskets are not strictly comparable.
What does the Consumer Price Index measure?
The Consumer Price Index (CPI), also called the cost of living index, measures average change in retail prices. Retail prices are the prices paid by consumers for the items in the basket. The index is interpreted for the consumer group it represents.
CPI = ΣWR / ΣW
Here W remains the expenditure weight and R the price relative for each item. The formula combines price changes with the importance of the items in the consumer’s expenditure.
Worked example 5. The CPI for industrial workers is 277 in December 2014, with 2001 = 100. Interpret it for a basket costing Rs 100 in 2001.
Answer: The identical basket requires Rs 277 in December 2014. The comparison concerns the worker’s ability to buy it. It is not necessary that the worker actually buys that basket.
Why are different consumer indices needed?
Items have different importance for different consumer groups. India has consumer price indices for industrial workers, agricultural labourers and rural labourers, as well as rural, urban and combined consumer indices. Indices are also available at state level.
A petrol price rise may not directly impact the living condition of poor agricultural labourers. A basket should therefore be as representative as possible of the group concerned. An index for one group cannot simply be treated as a description of every consumer’s experience.
What do the combined index weights show?
For the combined series with base 2012 = 100, the following group weights describe the distribution of importance in the basket:
| Major group | Weight |
|---|---|
| Food and beverages | 45.86 |
| Pan, tobacco and intoxicants | 2.38 |
| Clothing & footwear | 6.53 |
| Housing | 10.07 |
| Fuel & light | 6.84 |
| Misc. group | 28.32 |
| General | 100.00 |
Miscellaneous, abbreviated as Misc., groups items outside the separately named categories. Food and beverages have the greatest weight in this table. Changes in subgroup prices help identify which groups contribute to changes in the overall index.
The Consumer Food Price Index (CFPI) covers the food and beverages category except alcoholic beverages and prepared meals, snacks, sweets and similar items. This makes its coverage different from that of the full food and beverages group.
What does the Wholesale Price Index show?
The Wholesale Price Index (WPI) measures changes in the general price level using prices prevailing at the wholesale level. Wholesale prices relate to this stage of trade rather than retail purchases by a particular consumer group.
Unlike the CPI, the WPI has no reference consumer category. It covers goods and excludes services, such as barber charges and repairing. The distinction between goods and services therefore matters when identifying what its movement represents.
A WPI of 253 in October 2014, with 2004-05 as base, indicates a general price level 153 per cent above the base. The index level and the percentage increase are different: the base value of 100 must be allowed for.
How are the wholesale groups weighted?
The WPI series with base 2011-12 = 100 had a value of 112.8 in May 2017. Its group weights are:
| Major group | Weight |
|---|---|
| Primary Articles | 22.62 |
| Fuel and Power | 13.15 |
| Manufactured Products | 64.23 |
| All Commodities ‘Headline Inflation’ | 100.00 |
| ‘WPI Food Index’ | 24.23 |
Headline inflation often refers to the all-commodities inflation rate. Wholesale price data are usually available quickly. The WPI Food Index combines food articles from the primary articles group with food products from manufactured products.
Core inflation measured using the WPI focuses on manufactured goods other than food articles and also excludes fuel. These items account for around 55 per cent of the WPI weight. This narrower measure answers a different question from the all-commodities measure.
The food index is drawn from existing major groups. Its weight should not be read as an additional independent group alongside primary articles, fuel and power, and manufactured products.
How does the Index of Industrial Production measure quantities?
The Index of Industrial Production (IIP) tries to measure changes in quantities produced. It is a weighted arithmetic mean of quantity relatives, which compare an item’s output in the current period with its output in the base period.
Weights are allotted in proportion to value added by manufacture in the base year, meaning the value contributed through manufacturing. The IIP uses Laspeyre’s formula. Unlike the CPI and WPI, its central concern is industrial output rather than prices.
In the formula below, IIP₀₁ is the industrial production index for period 1 relative to period 0. The subscript i identifies a good, qᵢ₁ is its current-to-base quantity ratio and Wᵢ is its weight. The sums cover all n goods.
IIP₀₁ = (Σqᵢ₁Wᵢ / ΣWᵢ) × 100
Here the quantity ratio is used before multiplication by 100. Keeping that distinction clear prevents the percentage conversion from being applied twice.
What are the main industrial sectors?
The IIP base was fixed at 2011-12 = 100 with effect from April 2017. The main branches and their weights are:
| Sector | Weight |
|---|---|
| Mining | 14.4 |
| Manufacturing | 77.6 |
| Electricity | 8.0 |
| General Index | 100.0 |
Manufacturing has the greatest weight in this sector classification. Indices are available for sectors and subsectors. They can also be arranged by the use of products rather than by the industrial sector producing them.
The eight core industries are coal, crude oil, natural gas, refinery products, fertilisers, steel, cement and electricity. Together they have a weight of 40.27 per cent in the IIP.
The industrial basket needs revision as production changes. Every year, many items stop being manufactured or become inconsequential, while many new items begin to be manufactured. A very old basket may therefore become less representative of industrial activity.
The agricultural production index provides a ready reckoner of agricultural performance. It illustrates the wider point that index numbers can summarise output changes outside industry as well as within it.
How are inflation and changes in index numbers connected?
Inflation is a general and continuing increase in prices. Its primary impact is to lower the value of money. A change in the price of one commodity should not be confused with this broader and continuing movement.
If inflation becomes sufficiently large, money may lose its traditional functions as a medium of exchange and a unit of account. A medium of exchange is something used to pay for transactions; a unit of account is the unit in which values are expressed.
How is the weekly inflation rate calculated?
Let Xₜ denote the WPI in week t and Xₜ₋₁ the WPI in the preceding week. The letter t identifies the week being considered. The weekly rate compares the increase in the index with the previous week’s index.
Inflation rate = [(Xₜ − Xₜ₋₁) / Xₜ₋₁] × 100
The symbol − means subtraction. The denominator is the earlier week’s index, so the formula measures a percentage change between those two weeks. Merely subtracting 100 from the current index answers a different question: change relative to its base.
Why must the comparison period be stated?
An index level summarises the position relative to a base period. An inflation rate summarises the change between specified periods. State which periods are being compared before interpreting the result, and keep the index series consistent.
The WPI is widely used to measure inflation. The Reserve Bank of India (RBI) uses the All-India Combined Consumer Price Index as the main measure of consumer price changes. Retail and wholesale indices describe different price coverage.
How do index numbers reveal purchasing power and real wages?
Purchasing power means what money can buy. A rise in money income does not by itself establish an equivalent improvement in living standards, because prices may also have risen. A cost of living index helps make this comparison.
Money wage is the wage expressed in money. Real wage expresses that wage in terms of purchasing power at base-period prices. When the cost of living index has a base value of 100, use:
Real wage = (Money wage / CPI) × 100
For purchasing power, distinguish an index expressed as a ratio from an index expressed with base 100. Purchasing power is the reciprocal, or one divided by the cost of living ratio. With a base-100 CPI, the equivalent calculation for one rupee is 100 divided by the CPI.
Worked example 6. In January 2005, CPI with 1982 = 100 is 526. Calculate the purchasing power of one rupee and the real wage corresponding to a money wage of Rs 10,000.
Answer: One rupee has purchasing power of Rs 100 / 526, approximately Rs 0.19 or 19 paise in 1982 terms. Real wage = (10,000 / 526) × 100, approximately Rs 1,901 at 1982 prices.
What salary would preserve the earlier standard?
If the worker received Rs 3,000 in 1982, the real wage of Rs 1,901 is lower than that earlier salary. To maintain the 1982 standard, the corresponding salary is Rs 3,000 × 526 / 100 = Rs 15,780.
The calculation compares the cost of the same standard of consumption. A larger money salary can therefore coexist with lower purchasing power. The relevant comparison is between the real wage and the earlier wage expressed at the same prices.
Note: An index of 150 means a 50 per cent increase over the base, so maintaining the purchasing power of the base salary requires a 50 per cent upward adjustment.
What issues and limitations matter when constructing an index?
The reliability and meaning of an index depend on choices made before calculation. A mathematically completed formula can still give a misleading picture if its purpose, basket, base period or data are unsuitable.
Which decisions must be made?
- Clarify the purpose. Decide what is to be measured. A volume index, which measures physical quantities, is inappropriate when the question requires a value index, which concerns money values.
- Select representative items. The basket should be as representative as possible of the activity or consumer group. Items do not have equal importance for different groups of consumers.
- Choose a suitable base. Select a year that is as normal as possible. Avoid years with extreme values and avoid a base period too far in the past.
- Choose the formula. The question being studied determines the suitable method. Laspeyre’s and Paasche’s formulae differ in whether base-period or current-period quantities supply the weights.
- Check data reliability. Poorly reliable data produce misleading results. Use care in collecting information and choose the most reliable secondary source when primary data are not used.
Primary data are collected directly for the enquiry; secondary data come from information already collected. Whatever the source, reliability matters because the formula cannot remove errors in the underlying observations.
Why must the base year be updated?
A comparison between 1993 and 2005 is more meaningful than one between 1960 and 2005 when older consumption baskets contain items that have disappeared. Changes in goods and consumption make routine revision of the base year necessary.
An index is a summary of selected related variables. Its interpretation must retain the identity of those items, the period of comparison and their weights. It cannot replace careful attention to how the underlying basket was chosen.
What can historical index series and graphs tell us?
A time series is a sequence of observations arranged over time. Historical index series show how an index moves across years. The following values keep each series’ own base: 1982 = 100 for industrial workers’ CPI and 1993-94 = 100 for WPI.
| Year | Industrial workers’ CPI, 1982 = 100 | WPI, 1993-94 = 100 |
|---|---|---|
| 1995-96 | 313 | 121.6 |
| 1996-97 | 342 | 127.2 |
| 1997-98 | 366 | 132.8 |
| 1998-99 | 414 | 140.7 |
| 1999-00 | 428 | 145.3 |
| 2000-01 | 444 | 155.7 |
| 2001-02 | 463 | 161.3 |
| 2002-03 | 482 | 166.8 |
| 2003-04 | 500 | 175.9 |
How should the series be plotted?
Diagram
Industrial workers’ consumer prices
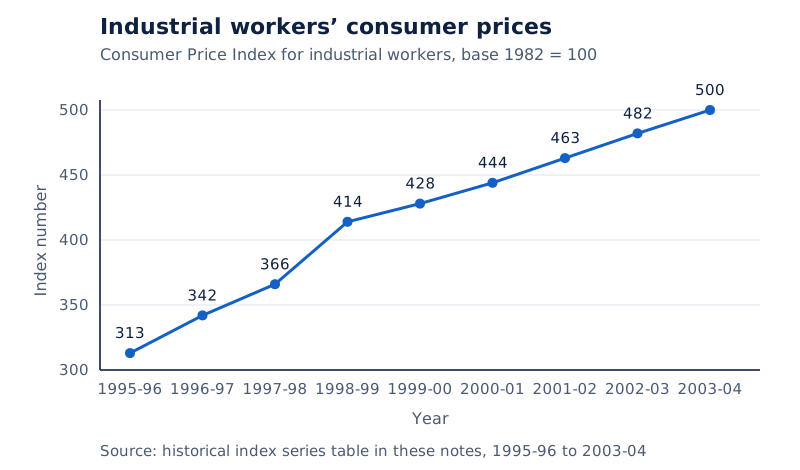
Put the nine years from the table on the horizontal axis and CPI on the vertical axis. Plot and join the CPI observations in year order. Label the base clearly as 1982 = 100.
Drawn by One Young India.
Diagram
Wholesale prices
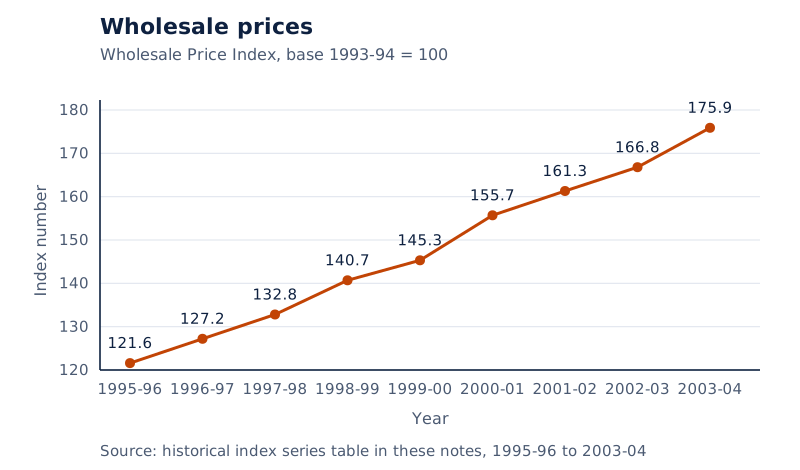
Draw a separate line graph using the same years on the horizontal axis and the WPI column on the vertical axis. Label the base 1993-94 = 100. Plot the printed decimal values without replacing them with rounded integers.
Drawn by One Young India.
Both series rise across the listed years. Industrial workers’ CPI moves from 313 to 500, while WPI moves from 121.6 to 175.9. These are movements within each specified series, rather than a claim that their numerical levels are directly comparable.
The different bases and different price coverage matter. A higher numerical CPI than WPI does not, by itself, establish that retail prices rose faster over the same interval. Compare changes over a common interval and identify what each series measures.
How are index numbers used in economic decisions?
Index numbers summarise information used in economic policy, meaning decisions concerning economic activity, incomes and prices. Their usefulness extends beyond completing calculations: an index connects many observations with an interpretable measure of change.
What are the main policy uses?
- CPI and living costs: consumer indices assist wage negotiations, income policy, price policy, rent control, taxation and general economic policy formulation.
- WPI and price effects: the wholesale index helps remove the effect of price changes from aggregates, meaning combined totals such as national income and capital formation.
- Production indices: industrial and agricultural indices summarise changes in the output of these sectors.
National income is an economy-wide income total, while capital formation concerns additions to productive capital. Removing price effects helps distinguish changes in money-valued totals from the influence of changing prices.
What does Sensex indicate?
Sensex is the Bombay Stock Exchange Sensitive Index, a benchmark for the Indian stock market. A benchmark is a reference measure used for comparison. Sensex uses 1978-79 as its base and covers 30 stocks representing 13 sectors.
Stocks are shares in companies. These companies are leaders in their respective industries. A rising Sensex indicates that the market is doing well, that investors expect better company earnings and that confidence in the economy’s basic health is growing.
The Human Development Index (HDI) is another index widely used to understand a country’s development. It illustrates that the use of indices extends beyond prices and quantities to broader questions of development.
The Economic Survey, a publication carrying economic information, provides widely used series such as WPI, CPI, industrial production, yield of principal crops and foreign trade indices. Choose the series that matches the question and interpret its construction carefully.
Glossary
- Index number — A statistical measure summarising average change in a group of related variables across two situations.
- Base period — The reference period against which change is measured, conventionally assigned an index value of 100.
- Current period — The period whose prices or quantities are being compared with those of the base period.
- Price relative — A commodity’s current price divided by its base price, usually multiplied by 100.
- Weight — A measure representing an item’s relative importance in the construction of a weighted index.
- Laspeyre’s price index — A weighted aggregative price index using base-period quantities to specify the basket being compared.
- Paasche’s price index — A weighted aggregative price index using current-period quantities to specify the basket being compared.
- Consumer Price Index — An index measuring average changes in retail prices, also called the cost of living index.
- Wholesale Price Index — An index of changes in the general price level using wholesale goods prices and excluding services.
- Index of Industrial Production — A weighted index of quantity relatives that summarises changes in industrial production.
- Inflation — A general and continuing rise in prices whose primary impact is lowering money’s value.
- Purchasing power — The ability of money to buy goods, which changes when the cost of living changes.
- Real wage — A money wage adjusted using the cost of living index to express base-period purchasing power.
Common errors and misconceptions
- Misconception: An index of 250 means the value has increased by 250 per cent. Correct: It means the value is two and a half times its base value of 100.
- Misconception: A simple aggregative index reflects the relative importance of every commodity. Correct: It does not properly account for different importance and is also affected by differing price units.
- Misconception: Laspeyre’s and Paasche’s indices use the same basket. Correct: Laspeyre’s uses base-period quantities, whereas Paasche’s uses current-period quantities.
- Misconception: CPI and WPI cover the same prices. Correct: CPI concerns retail prices; WPI uses wholesale goods prices and excludes services.
- Misconception: An increased money wage proves improved living standards. Correct: Compare real wages after allowing for changes in the cost of living.
- Misconception: Any distant year is equally suitable as a base. Correct: The base should be as normal as possible and not too far in the past.
- Misconception: Subtracting 100 from an index gives its weekly inflation rate. Correct: Weekly inflation compares successive weekly indices, using the preceding week’s index as the denominator.
Exam-style questions with model answers
Q1. Define an index number and explain the role of the base period. [2 marks]
- An index number summarises average change in a group of related variables across two situations.
- The base period provides the reference for comparison and is conventionally assigned an index value of 100.
Q2. Prices in Rs for commodities A, B, C and D are respectively 2, 5, 4 and 2 in the base period, and 4, 6, 5 and 3 in the current period. Calculate and interpret the simple aggregative price index, rounding to one decimal place. [3 marks]
- Sum the prices for the same four commodities in each period. Base-period prices total 2 + 5 + 4 + 2 = Rs 13, and current-period prices total 4 + 6 + 5 + 3 = Rs 18.
- The simple aggregative price index equals the current price sum divided by the base price sum, multiplied by 100: (18 / 13) × 100 = 138.5, rounded.
- With the base index set at 100, the result indicates an overall price rise of 38.5 per cent under this method.
Q3. Explain four differences between the Consumer Price Index and the Wholesale Price Index. [4 marks]
- CPI measures average change in retail prices, whereas WPI measures the general price level using prices prevailing at the wholesale level.
- CPI relates to a reference consumer group or population; WPI has no reference consumer category.
- CPI includes consumer goods and services, such as housing rent, whereas WPI includes goods only and excludes services such as barber charges and repairing.
- CPI assists wage negotiations and cost of living comparisons. WPI helps remove price effects from economic aggregates and is widely used to measure inflation.
Q4. The price relatives of A, B, C and D are 200, 120, 125 and 150, with expenditure weights of 40, 30, 20 and 10 per cent respectively. Calculate the weighted price index and interpret it. [3 marks]
- Multiply each price relative by its expenditure weight and add the products: 40 × 200 + 30 × 120 + 20 × 125 + 10 × 150 = 15,600.
- The total weight is 40 + 30 + 20 + 10 = 100. The weighted price index is therefore 15,600 / 100 = 156.
- The result indicates a price rise of 56 per cent over the base. Commodity A has the largest weight and its price has doubled, strongly influencing the weighted result.
Q5. Explain five issues that must be considered when constructing an index number. [5 marks]
- Clarify the purpose of the index. The calculation must measure the change actually being investigated; a volume index is unsuitable when a value index is needed.
- Choose representative items. Different commodities have different importance for different consumer groups, so the basket must match the group or activity being studied.
- Select an appropriate base year. It should be as normal as possible, avoid extreme values and not be too far in the past.
- Choose the formula to suit the question. For example, Laspeyre’s and Paasche’s price indices use different periods’ quantities as weights.
- Use reliable data. Poor reliability can produce misleading results; where primary information is not collected, select the most reliable available secondary source.
Q6. A worker earned Rs 3,000 in 1982 and Rs 10,000 in January 2005. The January 2005 CPI is 526 with 1982 = 100. Calculate the purchasing power of one rupee, the real wage and the salary required to preserve the 1982 standard, and assess the worker’s position. [5 marks]
- With the index expressed on a base of 100, the purchasing power of one rupee is 100 / 526, approximately Rs 0.19 or 19 paise at 1982 prices.
- Real wage equals money wage divided by CPI, multiplied by 100. Therefore, (10,000 / 526) × 100 gives approximately Rs 1,901 at 1982 prices.
- This means that Rs 10,000 in January 2005 buys what approximately Rs 1,901 could buy in the base year, despite the higher money wage.
- The earlier salary was Rs 3,000 at 1982 prices. Since the current real wage is lower, the worker is worse off in purchasing-power terms.
- Maintaining the earlier standard requires the base salary multiplied by the price-change factor: Rs 3,000 × 526 / 100 = Rs 15,780.
Q7. An industrial worker’s CPI is 277 in December 2014 with 2001 = 100. What does it imply for an identical basket costing Rs 100 in 2001? Must the worker actually purchase it? [2 marks]
- The basket costing Rs 100 in 2001 requires Rs 277 in December 2014.
- The worker need not actually purchase it; the comparison concerns the capability to buy the identical basket.
Q8. Explain the meaning of inflation, its primary effect on money and its possible effect when sufficiently large. [3 marks]
- Inflation means a general and continuing increase in prices. Its meaning concerns a broad price movement over time, rather than merely a change in one commodity’s price.
- Its primary impact is to lower the value of money: a given amount has reduced purchasing power as the cost of living rises.
- If inflation becomes sufficiently large, money may lose its traditional functions as a medium of exchange and a unit of account. This is a conditional possibility, not an inevitable result of every price rise.
Key takeaways
- Index numbers summarise changes in related variables, using a base period conventionally assigned a value of 100.
- A simple aggregative price index divides the sum of current prices by the sum of base prices and multiplies by 100.
- Laspeyre’s price index uses base-period quantities as weights; Paasche’s price index instead uses current-period quantities.
- Weighted price relatives reflect expenditure importance, so a heavily weighted item’s price change has a greater influence.
- CPI measures retail price changes, WPI concerns wholesale goods prices, and IIP summarises industrial quantity changes.
- Real wages adjust money wages for living costs, revealing whether increased money income preserves earlier purchasing power.
- A suitable purpose, representative basket, normal base period, appropriate formula and reliable data are essential for meaningful interpretation.
- Interpret historical series with their own bases and coverage; different numerical index levels do not establish directly comparable price changes.
Test yourself
What does an index of 250 mean when the base is 100?
The measured value is two and a half times its base-period value.
Which quantities are used in Laspeyre’s price index?
It uses base-period quantities as weights, keeping the base-period basket fixed.
Why can Paasche’s price index differ from Laspeyre’s?
Paasche’s uses current-period quantities as weights, so the basket being valued can differ.
Why is one CPI not equally representative of all consumer groups?
Different consumer groups attach different expenditure importance to items, requiring representative baskets and weights.
Does WPI include barber charges and repair services?
No. It includes wholesale goods prices and excludes these service charges.
What makes a base year suitable for comparison?
It should be as normal as possible, avoid extreme values and not be too far in the past.
What are the three main industrial branches in IIP?
The three main branches are mining, manufacturing and electricity.
How is real wage calculated with a base-100 CPI?
Divide the money wage by the CPI and multiply the result by 100.
Write about it
Turn a question from this chapter into a paper.
The Writing Studio has a structure guide, a rubric and citation tools for 15 formats, from essays to research papers. Drafting is free with an account. Learnacy Essential adds feedback from an AI writing coach and submission to The OYI Review.
Learnacy Essential is ₹1,499 for the year. Publication depends on review and is not guaranteed.