
Economic Growth and Development | ISC Class 11 Economics Notes
On this page
Watch & explore
Start with a few high-quality watches, then dive into the notes below.
Try an idea before you read. Step into the role of an economic analyst evaluating a nation's macroeconomic performance and choosing the right welfare measures. Explore →
Economic growth and development: real income, productive capacity, qualitative improvement, differences between growth and development, per capita income, income distribution, public facilities, human capabilities, structural change and the assessment of progress.
What is economic growth?
Definition: Economic growth means an increase in the real national income of a country. It is also understood through the expansion of the country's capacity to produce goods and services.
Real income concerns the goods and services that income represents, allowing for changes in prices. Growth therefore concerns an increase in production, rather than merely a larger money value caused by higher prices. The word real is important when interpreting an increase in income over time.
What expands productive capacity?
A country can produce more through a larger stock of productive capital, better supporting services such as transport and banking, or greater efficiency in using capital and services. These changes concern the economy's ability to supply output.
For instance, a farmer may increase output by adopting new seed varieties. A factory may increase production through a new type of machine. Both examples link growth to changes in the productive process, rather than treating income as something that increases without a cause.
Gross Domestic Product (GDP) is the market value of final goods and services produced within a country during a year. A steady increase in GDP is an important indicator of growth. When judging actual production growth, changes in prices must also be considered.
How can price changes exaggerate growth?
Amounts in the following calculation are in rupees (₹); × denotes multiplication.
Worked example 1. A country produces only bread. In 2000 it produces 100 units at ₹10 each. In 2001 it produces 110 units at ₹15 each. Calculate 2001 GDP at current prices and at the fixed prices of 2000.
Answer: GDP at current prices in 2001 = 110 × ₹15 = ₹1,650. GDP at the fixed prices of 2000 = 110 × ₹10 = ₹1,100. GDP in 2000 was 100 × ₹10 = ₹1,000.
Nominal GDP values production at current prices; real GDP values it at a constant set of prices. The increase to ₹1,650 includes the higher price of bread. The increase from ₹1,000 to ₹1,100 measures the production change using the same prices.
For the economy producing only bread, let be the current year's quantity of bread, its current price and its base year price. Quantity is measured in units of bread and prices in rupees per unit.
Nominal GDP: . Real GDP: . Both results are in rupees, but real GDP holds the price fixed. For 2001, these give ₹1,650 and ₹1,100 respectively.
GDP deflator: . This price index compares the current price level with the base year price level. Expressing the ratio as a percentage requires multiplication by 100.
For the bread economy, dividing ₹1,650 by ₹1,100 gives 1.50, or 150%. Bread therefore costs 1.5 times its base year price. The deflator helps distinguish a rise in prices from an increase in the volume of production.
What does growth tell us?
Growth tells us about the expansion of the economy's output and productive resources. More goods and services can provide the material basis for a richer and more varied life. However, the amount produced does not, by itself, explain how the resulting benefits are shared.
The distinction can be remembered through a cake. Growth makes the cake larger. The size of the cake tells us how much is available, but it does not establish how large a share each person receives. Distribution must therefore be considered separately.
What does economic development mean?
Definition: Economic development involves improvement in the quality of people's lives, alongside economic change. It extends beyond greater output to the opportunities, capabilities and living conditions that people actually enjoy.
Qualitative improvement means an improvement in conditions, rather than simply an increase in size or quantity. Health, education, access to resources, freedom and dignity help explain what makes life better. Development therefore cannot be assessed entirely by counting production.
Why are people central to development?
The idea of human development places people at the centre of progress. It involves enlarging their choices and improving their lives. A meaningful life requires more than survival: people should be able to develop their talents, participate in society and pursue goals they value.
An uneducated child cannot freely choose to become a doctor when lack of education prevents that choice. Similarly, a poor person may be unable to obtain medical treatment because resources are insufficient. Such restrictions show why income, knowledge and health matter together.
Development is consequently concerned with what people are able to do and become. An increase in output is valuable, but its significance for development depends on whether living conditions and opportunities improve. Capabilities connect available resources with the choices people can actually make.
How can size increase without qualitative improvement?
Consider a city whose population increases from one lakh to two lakhs while housing, basic services and other conditions remain unchanged. The city has grown in population, but the change does not demonstrate an improvement in the quality of life.
This is an illustration of the general distinction between growth in size and development. It is not a definition of economic growth, which concerns real income and productive capacity. The example shows why a larger quantity alone is insufficient evidence of better conditions.
How do economic growth and development differ?
Growth and development are related, but they answer different questions. Growth asks whether real output and productive capacity have increased. Development asks whether people's lives, opportunities and capabilities have improved. A complete comparison must explain both the connection and the difference.
What are the main points of comparison?
| Basis | Economic growth | Economic development |
|---|---|---|
| Central concern | Increase in real income and productive capacity. | Improvement in people's lives and opportunities. |
| Nature of change | Primarily quantitative: how much output increases. | Includes qualitative change: how living conditions improve. |
| Scope | Concentrates on the expansion of economic production. | Considers production alongside health, education, distribution and freedom. |
| Evidence | Changes in real income and the capacity to produce goods and services. | Income together with evidence about health, education and access to opportunities. |
| Distribution | A rise in total output does not establish who receives the gains. | Asks whether prosperity reaches poorer and disadvantaged people. |
| Relationship | Provides resources that can support better living conditions. | Examines the improvements achieved through economic and social change. |
The distinction is not that income matters for growth but has no place in development. Income is an important development goal because it helps people obtain goods and services. The difference is that development uses a broader set of considerations.
Why should the two concepts be studied together?
More production can support better consumption, education and health care. At the same time, healthier and better educated people can contribute more effectively to production. The relationship therefore includes both the contribution of resources to well-being and the contribution of capabilities to output.
A rise in real income establishes an expansion in economic resources. It does not establish that every household has become better off. Conversely, evidence about improved health or educational opportunity reveals an aspect of development that a production total alone cannot describe.
Note: Do not describe development as merely another name for growth. Explain the expansion of real output first, then consider the quality and distribution of the improvements in people's lives.
Why does economic growth not automatically ensure development?
An economy can have high growth and modern technology while most of its people continue to live in poverty. The existence of more output does not guarantee that poorer people receive the benefits of prosperity. This is why equity matters alongside growth.
What does equity add to growth?
Equity requires attention to basic needs and inequality. People should be able to obtain food, a decent home, education and health care. If prosperity is enjoyed mainly by the rich, greater production may coexist with serious deprivation among other sections of society.
Growth answers a question about the amount available. Equity asks about access to that amount and to the opportunities associated with it. The second question cannot be answered simply by repeating that the economy has produced more than before.
India's planning goals included growth, modernisation, self-reliance and equity. These goals were not identical. Their separate inclusion recognises that productive expansion, technological change and domestic capabilities do not, by themselves, ensure that basic needs are met.
Can output rise while most incomes fall?
Worked example 2. In 2000, an imaginary country has 100 people earning ₹10 each. In 2001, 90 people earn ₹9 each and the other 10 earn ₹20 each. Prices do not change. Compare GDP using the income totals.
Answer: GDP in 2000 = 100 × ₹10 = ₹1,000. GDP in 2001 = 90 × ₹9 + 10 × ₹20 = ₹810 + ₹200 = ₹1,010. GDP rises, but 90 people's incomes fall from ₹10 to ₹9 each.
The example establishes that higher total output and income can coexist with lower incomes for most people. It does not establish an improvement in everyone's welfare. The unchanged prices make this a comparison of real gains and losses, rather than a result of inflation.
How should an improvement be examined?
- Identify the increase in production or real income being reported.
- Ask which people receive the additional income or gain access to the goods and services.
- Examine whether basic needs, including health care and education, are being met more effectively.
- Consider whether poorer groups gain opportunities or remain excluded from the benefits.
This sequence brings growth and development into the same assessment without confusing them. A production increase is evidence about output. A claim about widespread improvement in living conditions also needs evidence about distribution, public facilities and the position of disadvantaged people.
Equal access to opportunities is especially important where gender, income or social discrimination restricts people's choices. Development concerns the reduction of such barriers as well as the resources available in the economy. The benefits of expansion must be examined from the standpoint of people.
How is per capita income calculated and interpreted?
Per capita income is average income per person. It is obtained by dividing a country's total income by its total population. Unlike total income alone, it takes account of the number of people among whom that income is distributed.
Per capita income: . Here, total income means the combined income for the period considered, and total population means the number of people. The result is income per person for that period.
Why is an average useful?
Countries have different populations. A larger total income does not necessarily mean that an average person has more income available. Dividing by population provides a common basis for comparison. However, an average remains a summary, rather than a statement of each individual's income.
The following comparison uses two illustrative countries, each with five citizens. Every income is a monthly amount in rupees. The labels A and B distinguish the two countries; they do not represent actual countries.
| Country | Citizen 1 | Citizen 2 | Citizen 3 | Citizen 4 | Citizen 5 | Monthly average |
|---|---|---|---|---|---|---|
| A | ₹9,500 | ₹10,500 | ₹9,800 | ₹10,000 | ₹10,200 | ₹10,000 |
| B | ₹500 | ₹500 | ₹500 | ₹500 | ₹48,000 | ₹10,000 |
Worked example 3. Country A has five citizens with monthly incomes of ₹9,500, ₹10,500, ₹9,800, ₹10,000 and ₹10,200. Calculate its monthly per capita income.
Answer: Total monthly income = ₹9,500 + ₹10,500 + ₹9,800 + ₹10,000 + ₹10,200 = ₹50,000. Average monthly income = ₹50,000 ÷ 5 = ₹10,000 per person.
Worked example 4. Country B has five citizens. Four receive ₹500 each per month and the fifth receives ₹48,000. Calculate its monthly per capita income and compare it with Country A's ₹10,000.
Answer: Total monthly income = ₹500 + ₹500 + ₹500 + ₹500 + ₹48,000 = ₹50,000. Average monthly income = ₹50,000 ÷ 5 = ₹10,000. The averages are equal, although most citizens in B receive far less than that average.
The examples show why calculation and interpretation belong together. The arithmetic correctly produces the same average for both countries. It does not follow that their citizens have similar incomes or that prosperity is shared equally in the two societies.
What are the limitations of average income as a development measure?
The main limitation of average income is that it hides the distribution of income. A high income received by a small group can coexist with low incomes for most people. The average does not tell us which situation exists without further information.
What does the two-country comparison establish?
In Country A, the five monthly incomes lie close to ₹10,000. In Country B, four citizens receive ₹500 each and one receives ₹48,000. Both averages equal ₹10,000, but their distributions differ sharply. A has a more equitable distribution in this illustration.
It would therefore be incorrect to say that every citizen earns the average. It would also be incorrect to conclude that both societies are equally developed from their equal averages alone. Income distribution and other conditions must be examined before reaching that judgement.
Cartoon: Country with No Rich and No Poor. Five people sit on separate chairs. The speech bubble says, "WE MADE THE CHAIRS AND WE USE THEM." Cartoon: Country with Rich and Poor. One person reclines across several chairs while four others crowd onto one chair. Their speech bubble says, "WE MADE THE CHAIRS AND HE TOOK THEM."
How can an average help recover missing information?
Worked example 5. Four families have an average income of ₹5,000. Three family incomes are ₹4,000, ₹7,000 and ₹3,000. Find the fourth family's income, treating each family as one observation in the average.
Answer: Combined income = ₹5,000 × 4 = ₹20,000. The three known incomes total ₹4,000 + ₹7,000 + ₹3,000 = ₹14,000. The fourth income is ₹20,000 − ₹14,000 = ₹6,000. All amounts refer to the same unspecified period.
This calculation concerns an average of four family incomes. A true per person calculation would require the number of people. The data are sufficient for the stated family-average question, but do not provide family sizes or establish each member's income.
Finally, even a distribution table does not measure every development goal. Security, freedom, respect, health and educational opportunity cannot all be read from income figures. Average income is useful, but a useful indicator need not be a complete indicator.
Why do public facilities and social indicators matter?
Income enables people to obtain many goods and services, but money in an individual's pocket cannot secure everything needed for a good life. A clean environment, protection from infectious disease and access to educational facilities often depend on wider community arrangements.
How do public facilities support development?
Public facilities are services and arrangements available for people's shared needs, including schooling and health care. For many important goods and services, collective provision can be the best and cheapest way to make them available. Individual purchasing power does not replace every collective requirement.
Kerala's relatively low infant mortality is linked to adequate basic health and educational facilities. Haryana has a higher per capita income in the comparison, but this does not place it ahead on every social indicator. The comparison shows why income and health must be examined separately.
Infant mortality rate measures deaths before one year of age per 1,000 live births in a particular year. It provides evidence about survival early in life. Literacy rate measures the proportion of literate people in the population aged seven years and above.
These indicators address different aspects of living conditions. A development assessment can therefore combine income with information about health and education. The object is to understand people's lives more fully, rather than to replace one isolated number with another isolated number.
What can school attendance data reveal?
Worked example 6. For rural children aged 10 to 14 in Uttar Pradesh, school attendance is 85% for boys and 82% for girls. Calculate the percentage not attending school in each group. The percentage sign means a number out of every hundred.
Answer: Boys not attending = 100% − 85% = 15%. Girls not attending = 100% − 82% = 18%. These are percentages within the respective groups, not the numbers of children. The data show a larger non-attending share among girls.
The calculation does not establish why particular children are absent. It does reveal a gap in participation that an income average would miss. Questions about educational access are therefore central to judging whether development opportunities are widely available.
The Human Development Index (HDI) brings together health, education and access to resources in assessing human development. Its broader perspective reinforces the central point: production and income matter, but development also concerns people's ability to lead healthy and informed lives.
How do human capital and human development relate to growth?
Education and health connect growth with development, but the connection can be viewed in different ways. Human capital emphasises the contribution of people's knowledge, skills and health to production. Human development emphasises people's well-being and the choices they can make.
How can education and health raise production?
Education can improve a person's skills and ability to contribute to income. Good health can allow a person to provide labour more continuously over a longer period. Training and information also matter for the productive use of human abilities.
From this perspective, spending on education and health is an investment in human capital. It can improve labour productivity and support economic growth. Labour productivity concerns the productive contribution of human work, rather than simply the number of people present.
Better education and health thus have an economic role. The resources generated by production can help support these services, while better capabilities can contribute to production. This connection helps explain why the growth and development questions are related.
Why is well-being valuable beyond productivity?
The human development perspective values basic education and health in themselves. People should be able to read, write and lead healthy lives even where an investment does not produce a measurable increase in labour productivity. Human beings are the purpose of development.
| Perspective | Education and health are valued for | Main emphasis |
|---|---|---|
| Human capital | Their contribution to skills, labour productivity and output. | People's productive contribution to economic growth. |
| Human development | Their contribution to well-being and valued choices, including benefits beyond production. | People's lives and capabilities as ends in themselves. |
The difference is especially useful when explaining why a production figure cannot express every benefit of better health or education. A healthier life is an improvement for the person concerned. Its significance is not exhausted by calculating additional goods and services produced.
How do structural change and modernisation relate to development?
Structural composition refers to the contributions of agriculture, industry and services to an economy's output. Growth can arise from different sectors, so understanding an economy involves examining both total output and the sectors producing it.
What is structural change?
Structural change occurs when the relative importance of sectors changes as an economy develops. Usually, agriculture's share declines and industry becomes more prominent. At higher levels of development, services contribute more to GDP than the other two sectors.
India's experience illustrates why this is not a rigid sequence for every economy. By 1990, services contributed 40.59% of GDP, more than agriculture or industry. This is a historical example of sectoral composition, rather than a claim about the present share.
Changing sectoral shares describe changes in the sources of production. They should not be treated as sufficient proof that everyone has benefited. The separate questions of employment opportunities, access to services and distribution remain relevant to the quality of development.
Diagram
Sectoral contributions to GDP in 1950 to 1951
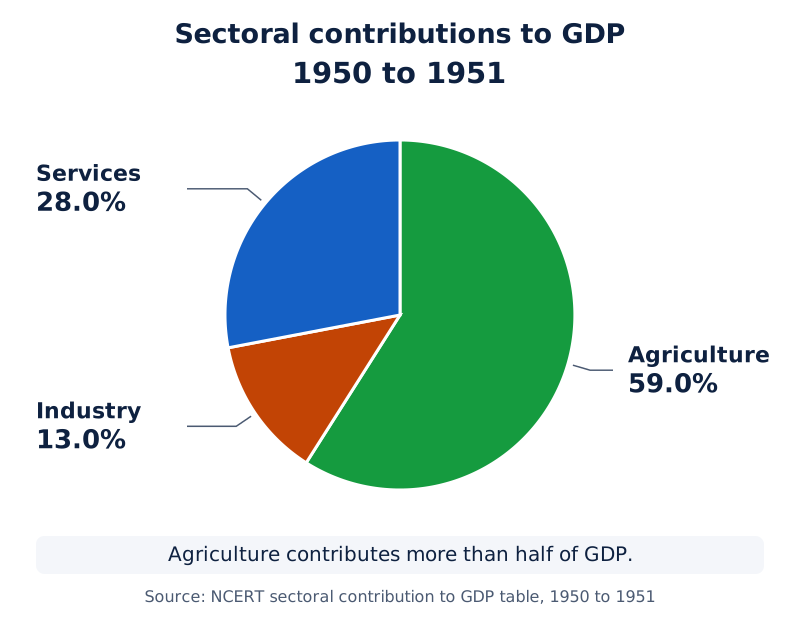
Draw a pie chart with labelled slices for agriculture, 59.0%; industry, 13.0%; and services, 28.0%. Agriculture occupies more than half the circle, while industry has the smallest share.
Drawn by One Young India.
Diagram
Sectoral contributions to GDP in 1990 to 1991
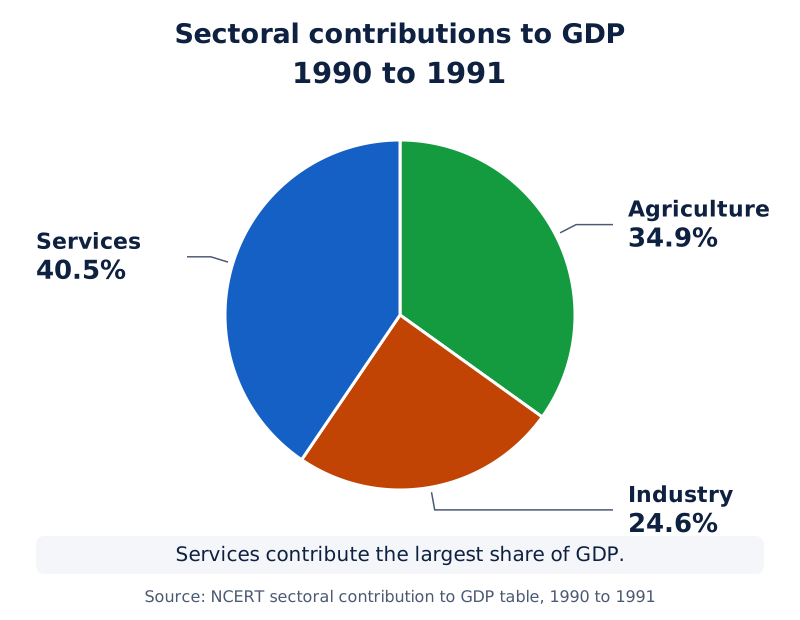
Draw a second pie chart with labelled slices for agriculture, 34.9%; industry, 24.6%; and services, 40.5%. The exercise uses 40.5% for services, while the earlier historical description gives 40.59%; use 40.5% for this chart so the slices total 100%. Services now have the largest share. Compared with 1950 to 1951, agriculture's share falls while industry and services gain.
Drawn by One Young India.
What does modernisation involve?
Modernisation includes using new technology to increase production. New seed varieties on farms and new machines in factories are examples. It also includes changes in social outlook, such as recognising that women should have the same rights as men.
These aspects help explain the breadth of development. Technological change concerns productive methods. A change in attitudes towards women's rights concerns participation and opportunity. Both can be significant, but they should not be confused with the same numerical measure.
Development goals can also create difficult choices. A technology that reduces the need for labour may conflict with the aim of increasing employment. Decisions must therefore consider the effects of a productive change on people, as well as its ability to increase output.
Note: Sectoral change and modern technology are relevant evidence about an economy. Neither removes the need to examine poverty, basic needs and the distribution of opportunities.
How should different development goals be evaluated?
People's development goals reflect their circumstances. Landless rural labourers may seek more work, better wages, good schooling and freedom from discrimination. Prosperous farmers from Punjab may seek higher crop support prices and inexpensive labour. Their interests do not necessarily coincide.
Why can development goals conflict?
Industrialists may favour dams that supply more electricity. People whose land is submerged may experience displacement and disruption instead. Increased power production is relevant to growth, while the effects on people's homes and lives are essential to judging development.
Similarly, a job with higher pay may provide little security or family time. Another job may pay less but offer regular employment and a greater sense of security. Income and non-income goals must therefore be considered together when evaluating improvements in life.
National development requires discussion of whose needs are being met. A policy that benefits a small group cannot be assumed to improve everyone's position. The assessment must consider the range of effects and whether a fairer way of meeting the goals is available.
What questions make an assessment more complete?
- Production: Has the economy's real income or capacity to produce increased?
- Distribution: Do poorer people share in the gains, or are benefits concentrated?
- Basic services: Are health, education and other essential facilities more accessible?
- Choices: Do people have greater freedom, security and opportunities to pursue valued goals?
- Continuity: Are resources and opportunities being maintained for future generations?
The final question introduces sustainability, the continuity of opportunities over time. Misusing environmental, financial or human resources can restrict the choices of future generations. Present improvements therefore need to be considered alongside the conditions inherited by those who follow.
A sound assessment recognises economic growth where the evidence establishes it, then examines the wider consequences. It does not dismiss income, and it does not equate income with every dimension of progress. Development combines economic resources with better conditions for human life.
Glossary
- Economic growth — An increase in real national income, associated with an expansion in the capacity to produce goods and services.
- Economic development — Improvement in people's living conditions and opportunities, extending beyond an increase in economic output alone.
- Real income — Income considered in terms of goods and services, allowing for changes in their prices.
- Gross Domestic Product — The market value of final goods and services produced within a country during a year.
- Per capita income — Average income per person, calculated by dividing total income by the total population.
- Income distribution — The way income is shared among people, which a single average cannot fully reveal.
- Equity — Concern for basic needs, reduced inequality and fair access to the benefits and opportunities of development.
- Public facilities — Collectively provided services and arrangements, such as schooling and health care, supporting people's shared needs.
- Human capital — People's knowledge, skills and health considered in terms of their contribution to production and income.
- Human development — Development that enlarges people's choices and improves their lives, placing human well-being at its centre.
- Modernisation — Adoption of new technology and changes in social outlook, including recognition of equal rights for women.
- Structural change — A change in the relative contributions of agriculture, industry and services as an economy develops.
- Sustainability — Continuity of opportunities through the responsible use of resources, keeping the needs of future generations in view.
Common errors and misconceptions
- Misconception: Growth and development mean the same thing. Correct: Growth concerns expanding real income and production; development also concerns living conditions, capabilities and opportunities.
- Misconception: Any rise in money income proves economic growth. Correct: Changes in prices must be considered when assessing whether real income and production have increased.
- Misconception: Every person earns the per capita income. Correct: Per capita income is an average; individual incomes may differ greatly from it.
- Misconception: Equal average incomes establish equal development. Correct: Distribution, health, education and other living conditions may differ despite identical averages.
- Misconception: Income is irrelevant because it is an incomplete indicator. Correct: Income remains important, but it should be considered alongside distribution and non-income indicators.
- Misconception: Education and health matter only when they raise production. Correct: Human development values them as parts of well-being, irrespective of their contribution to productivity.
- Misconception: A project that increases output benefits everyone. Correct: Different groups may face different effects, including displacement or loss of opportunities.
- Misconception: A growing city population is itself evidence of economic development. Correct: Population growth without better housing, services or living conditions does not establish development.
Exam-style questions with model answers
Q1. Define economic growth and state one reason why it does not fully describe development. [2 marks]
- Economic growth means an increase in a country's real national income and productive capacity.
- It does not establish how benefits are distributed or whether people's health, education and opportunities have improved.
Q2. Distinguish economic growth from economic development on three grounds. [3 marks]
- Growth concerns a quantitative increase in real income and output. Development includes qualitative improvements in living conditions and opportunities.
- Growth is assessed through production and income changes. Development also requires information about health, education, access to resources and freedom.
- Growth does not by itself reveal who receives additional income. Development asks whether poorer and disadvantaged people share in prosperity and gain access to basic needs.
Q3. Each of two countries has five citizens. Their monthly incomes are A: ₹9,500, ₹10,500, ₹9,800, ₹10,000 and ₹10,200; B: ₹500, ₹500, ₹500, ₹500 and ₹48,000. Calculate both averages and explain why the figures do not establish equal development. [4 marks]
- Country A's total monthly income is ₹50,000. Dividing this by its five citizens gives a monthly per capita income of ₹10,000.
- Country B's total is also ₹50,000, so its monthly per capita income is also ₹10,000.
- In A, the incomes lie close to the average. In B, four citizens earn only ₹500 while one receives ₹48,000. A therefore has a more equitable distribution in this example.
- Equal averages do not establish equal living conditions. Information about distribution, health, education and other opportunities is also needed to compare development.
Q4. Four family incomes, treated as four equally weighted observations for the same period, average ₹5,000. Three are ₹4,000, ₹7,000 and ₹3,000. Calculate the fourth income and explain whether the data establish income per family member. [3 marks]
- The combined income is the average multiplied by the number of observations: ₹5,000 × 4 = ₹20,000.
- The known incomes total ₹4,000 + ₹7,000 + ₹3,000 = ₹14,000. The fourth family's income is therefore ₹20,000 − ₹14,000 = ₹6,000.
- The data establish a family-income average. They do not give family sizes, so income per family member cannot be calculated.
Q5. Explain why equity and public facilities must be considered alongside economic growth when judging development. [5 marks]
- Economic growth increases real income and productive capacity. This can provide resources for improved living conditions, but does not establish who receives the benefits.
- Equity requires attention to poorer sections, basic needs and inequality. A growing economy may still contain widespread deprivation if gains are concentrated among richer people.
- Public facilities help meet shared needs such as schooling, health care and protection from infectious disease. Individual income cannot secure every condition required for a good life.
- For many important goods and services, collective provision is the best and cheapest way to make them available. Public facilities therefore help meet needs that individual purchases cannot adequately secure.
- Evidence about health and education complements income figures by showing whether people actually obtain essential services and opportunities.
Q6. Distinguish the human capital and human development perspectives on education and health. [4 marks]
- Human capital values education and health for increasing labour productivity; human development values them for improving well-being and enabling choices people value.
- Human capital treats people as means to the end of increased productivity; human development treats people as ends in themselves.
- In the human capital perspective, investment that does not enhance output is unproductive; human development supports investment in education and health even without higher output.
- Human capital assesses education and health through their productive contribution; human development regards basic education and health care as rights of every individual, irrespective of that contribution.
Q7. Among rural children aged 10 to 14 in Uttar Pradesh, 85% of boys and 82% of girls attend school. Calculate the non-attending percentage for each group and state one development implication. [3 marks]
- The share of boys not attending school is 100% − 85% = 15%.
- The share of girls not attending school is 100% − 82% = 18%. The non-attending proportion is therefore larger among girls.
- These figures show a gap in educational participation that average income alone cannot reveal. They concern shares within each group; without the total numbers of boys and girls, the numbers not attending cannot be calculated.
Q8. Industrialists favour a dam because it can supply more electricity. People whose land would be submerged fear displacement and disruption of their lives. Explain the conflict and how the project should be assessed in terms of growth and development. [5 marks]
- The industrialists focus on electricity that can support production. This relates to productive capacity and hence to the economic growth aspect of the project.
- The affected residents focus on the loss of land and disruption of their lives. A production gain does not remove these adverse effects on their living conditions.
- The situation illustrates conflicting development goals: what benefits one group may harm another. The project cannot be judged solely from the viewpoint of those receiving electricity.
- Assess how the productive benefits and the costs of displacement are shared between industrialists and affected residents, and whose needs the project meets.
- Consider whether a fairer way of meeting the goals is available. Include the affected residents' preferences when comparing alternatives to the proposed dam.
Key takeaways
- Economic growth concerns increasing real income and productive capacity; economic development also concerns improvements in people's lives and opportunities.
- Income supports development, but an increase in total output does not establish that all sections of society benefit.
- Per capita income adjusts total income for population, while leaving important questions about income distribution unanswered.
- Equal averages can conceal sharply different individual incomes, so development comparisons need evidence beyond a single income figure.
- Public facilities and indicators of health and education help show whether people can actually obtain essential services.
- Human development values education and health as parts of well-being, including benefits that do not increase productivity.
- Structural change and modernisation describe important changes, but equity and access to opportunities still require separate attention.
- Different groups may have conflicting goals; judging development requires examining benefits, adverse effects and opportunities for future generations.
Test yourself
Why does the definition of economic growth refer to real income?
Real income allows for changes in prices, helping distinguish increased production from a rise in money values alone.
What is the formula for per capita income?
Per capita income equals total income divided by total population, giving average income per person for the period considered.
What essential information does average income hide?
It hides how income is distributed among people and whether most receive incomes close to the average.
What does equity add to a growth assessment?
It asks whether poorer people share in prosperity, basic needs are met and inequalities are reduced.
Why can education be valuable even without higher productivity?
Education enlarges people's choices and is part of well-being, so its value extends beyond additional production.
Which three broad areas are brought together in human development assessment?
Health, education and access to resources are considered together to assess people's capabilities and living conditions.
Why can a dam create conflicting development goals?
Industrialists may value additional electricity, while people whose land is submerged may face displacement and disrupted lives.
Why must development consider future generations?
Misuse of resources today can reduce the opportunities available to future generations and undermine the continuity of development.
Try it
Analyzing National Progress: Growth vs. Development
Step into the role of an economic analyst evaluating a nation's macroeconomic performance and choosing the right welfare measures.
1Country X records a strong 7% increase in its real GDP over the year. However, national reports reveal that this wealth concentrated strictly in the top percentile, while unemployment and poverty rates remained unchanged. How should you analytically evaluate Country X's progress?
Correct. Economic growth is a purely quantitative measure of aggregate output and a necessary but not sufficient condition for development. When wealth concentrates at the top without reductions in poverty or unemployment, it results in 'ruthless growth' without true economic development.
Incorrect. The text states that growth is merely a means and does not automatically translate into development; without deliberate public policy and equitable distribution, growth fails to produce human development.
Incorrect. Growth is the quantitative expansion of real GDP, which Country X achieved. Development is multidimensional and requires reducing poverty, unemployment, and inequality.
2To better evaluate welfare improvements, policymakers want a composite metric that focuses purely on biological and educational outcomes while excluding monetary income entirely. Which metric should they select?
Incorrect. HDI includes a monetary dimension: Decent Standard of Living measured by Gross National Income (GNI) per capita in PPP US dollars on a logarithmic scale.
Correct. Morris D. Morris's PQLI takes the unweighted arithmetic mean of these three indicators and excludes monetary income entirely, focusing strictly on biological and educational welfare.
Incorrect. Real PCI is a traditional monetary measure that overlooks essential welfare dimensions like literacy and life expectancy.
You have successfully distinguished quantitative economic growth from multidimensional economic development and identified the appropriate composite indicators for measuring human welfare.