
Theory of Demand and Supply | ICSE Class 10 Economics Notes
On this page
Watch & explore
Start with a few high-quality watches, then dive into the notes below.

This note covers demand and supply, types and determinants of demand, individual and market schedules, the laws of demand and supply, movements and shifts of curves, exceptions to the law of demand, and the meaning, measurement, degrees and determinants of price elasticity.
What does demand mean, and how are its main types distinguished?
Definition: Demand is the quantity of a commodity, meaning a good, that a consumer is willing to buy and able to afford at a given price. A consumer is a person who uses goods or services to satisfy wants.
A desire alone does not constitute demand. Willingness to purchase and the ability to pay must accompany it. A demand statement should relate a quantity to a price and a specified period, so that quantities being compared refer to the same time interval.
How does the purpose of a purchase distinguish demand types?
- Direct demand arises when a good or service is wanted for the satisfaction it provides directly. Food bought for consumption illustrates this connection between a good and a consumer's wants.
- Derived demand arises because an input, meaning a resource used in production, is needed to produce another good or service. Demand for labour used by a producing business depends on the demand for its output, meaning the goods or services produced.
- Joint demand concerns goods wanted together for a purpose. Tea and sugar illustrate goods used together, so demand for one is connected with demand for the other.
- Composite demand arises when the same good is wanted for several different uses. The demands associated with those uses together contribute to the demand for that good.
How does the number of buyers distinguish demand?
Individual demand concerns one consumer. Market demand is the total demand of all consumers for the same good at a particular price. These categories describe whose demand is measured, whereas direct and derived demand describe why the good or service is wanted.
Keep the commodity, price and period consistent when combining purchases. A market total is formed by adding quantities demanded at the same price, rather than by adding the different prices that consumers might face.
How do demand schedules and curves express the law of demand?
A demand schedule lists quantities demanded at different prices, with other influences held constant. A demand curve presents that price-quantity relationship graphically. Price is measured on the vertical axis and quantity demanded on the horizontal axis.
Definition: The law of demand states that, other things being equal, quantity demanded rises when a commodity's price falls and falls when its price rises. The relationship between price and quantity demanded is negative.
The condition other things being equal means keeping the consumer's income, tastes and preferences, and the prices of other goods unchanged. Income means money received over a period; tastes and preferences describe the consumer's likes and choices among goods.
What does a demand schedule show?
In the following schedule, Rs. means rupees.
| Price per banana | Quantity demanded by the consumer |
|---|---|
| Rs. 5 | 15 bananas |
| Rs. 7 | 12 bananas |
In this example, the higher price is associated with a smaller quantity demanded. Each row supplies one point on a demand curve. The schedule describes the consumer's response to different prices; it does not say that both quantities are bought together.
Why does the curve generally slope downward?
Utility is the satisfaction obtained from consumption. Marginal utility is the additional satisfaction obtained from consuming one more unit. Under diminishing marginal utility, successive units provide less additional satisfaction while consumption of other goods is held constant.
The consumer is therefore unwilling to pay as much for each additional unit. A lower price makes an additional purchase worthwhile. This explains a downward-sloping demand curve through diminishing marginal utility.
A fall in price also makes the good cheaper relative to other goods. The resulting switch towards it is the substitution effect. The same money can now buy more; the change in consumption caused by this change in purchasing power is the income effect.
Which factors change demand, and how do related goods matter?
Determinants of demand are the influences on the quantity a consumer chooses. They include the good's own price, the consumer's income, prices of related goods, and tastes and preferences. The effect of a change depends on which determinant has changed.
How does income affect normal and inferior goods?
For most goods, demand increases as income increases and decreases as income decreases. These are normal goods. An inferior good has the opposite income relationship: demand falls when income rises and rises when income falls, other things unchanged.
Low-quality food items such as coarse cereals illustrate inferior goods. This classification depends on the consumer and income level. At very low income, demand for low-quality cereals can increase with income; beyond a level, further income increases are likely to reduce consumption as better-quality cereals are chosen.
How do substitutes differ from complements?
| Relationship | Meaning | Example and price connection |
|---|---|---|
| Substitutes | Goods used in place of one another | Tea and coffee: a rise in coffee's price is likely to increase consumption of tea. |
| Complements | Goods consumed together | Tea and sugar: a rise in sugar's price is likely to decrease demand for tea. |
Demand for a good usually moves in the direction of the price of its substitutes. In general, it moves in the opposite direction to the price of its complementary goods. These relationships concern another good's price, not the price of the good whose demand is being examined.
A favourable change in preferences raises demand at each price; an unfavourable change lowers it. The demand curve for ice-creams, for example, is likely to shift rightward in summer because preference for ice-creams increases.
For market demand, the number of consumers also matters. Adding buyers adds their quantities to the market total at each price, provided the demands of existing consumers remain unchanged. A change in the total must therefore be distinguished from a change in one person's demand.
How does a movement along a demand curve differ from a shift?
A movement along a demand curve occurs when the good's own price changes while the other determinants remain constant. The consumer moves between points on the same curve. A shift occurs when a determinant other than the good's own price changes.
What are extension and contraction of demand?
Extension of demand means a rise in quantity demanded caused by a fall in the good's own price. Contraction of demand means a fall in quantity demanded caused by a rise in its own price. Both describe movements on an unchanged demand curve.
Increase in demand means a rightward shift: more is demanded at the same price. Decrease in demand means a leftward shift: less is demanded at the same price. These expressions distinguish changes in the whole relationship from changes caused by the good's own price.
| Change | Cause | Graphical result |
|---|---|---|
| Extension | Own price falls, other things unchanged | Movement downward along the same demand curve |
| Contraction | Own price rises, other things unchanged | Movement upward along the same demand curve |
| Increase in demand | A favourable change in another determinant | Rightward shift of the demand curve |
| Decrease in demand | An unfavourable change in another determinant | Leftward shift of the demand curve |
What the figure shows
Movement and shift of demand
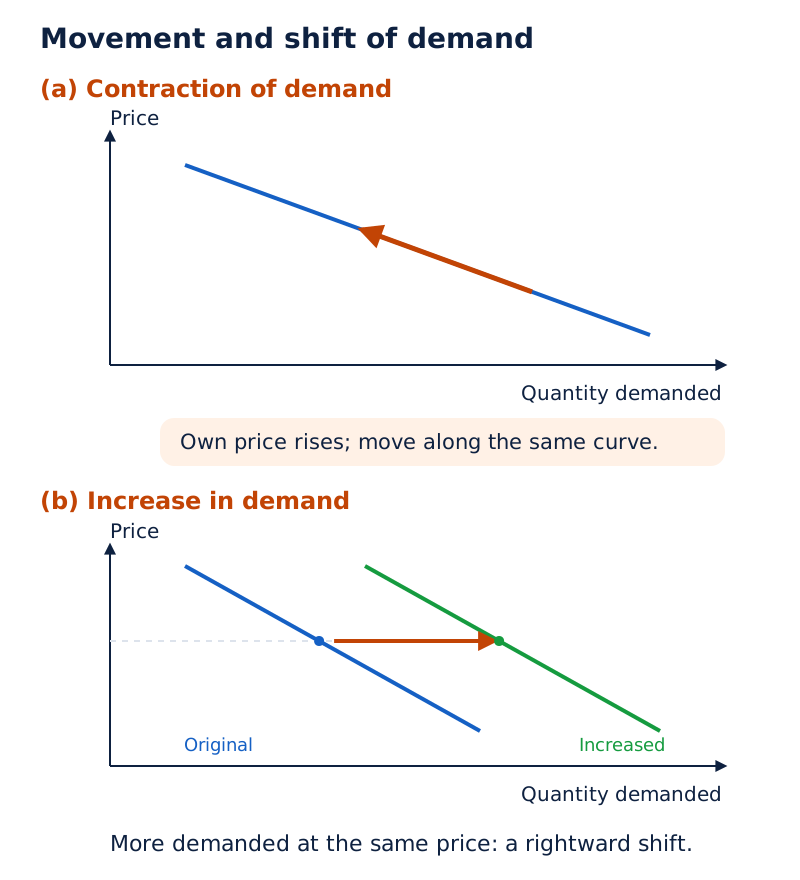
Both panels label price vertically and quantity horizontally. Panel (a) has one downward-sloping line and an arrow pointing upward along it. Panel (b) has two downward-sloping lines and an arrow pointing right between them.
Drawn by One Young India.
To classify a change, first identify the good under discussion. Then identify the changed factor. Finally ask whether quantity changes because of that good's own price or whether the consumer would choose a different quantity even at the original price.
Note: A rise in income increases demand for a normal good but decreases demand for an inferior good. Identify the nature of the good before deciding the direction of a shift.
How is market demand obtained from individual demand?
Market demand brings together the quantities demanded by every consumer in a market at each price. It represents the buyers collectively. An individual demand curve describes one buyer, so it cannot by itself represent the total purchases desired by all buyers.
What is horizontal summation?
Horizontal summation means adding quantities across individual curves at the same price. It is called horizontal because quantities are measured along the horizontal axis. Prices are held at a common level during each addition.
- Choose a price and locate that price on each consumer's demand curve or schedule.
- Read the quantity demanded by each consumer at this common price.
- Add those quantities to obtain the market quantity demanded at that price.
- Repeat the addition at other prices to obtain the market demand schedule and curve.
If a consumer demands nothing at a particular price, that consumer contributes zero to the total. The market total still includes any positive demands of other consumers. This matters because individual buyers need not stop buying at the same price.
What the figure shows
Combining individual demand curves
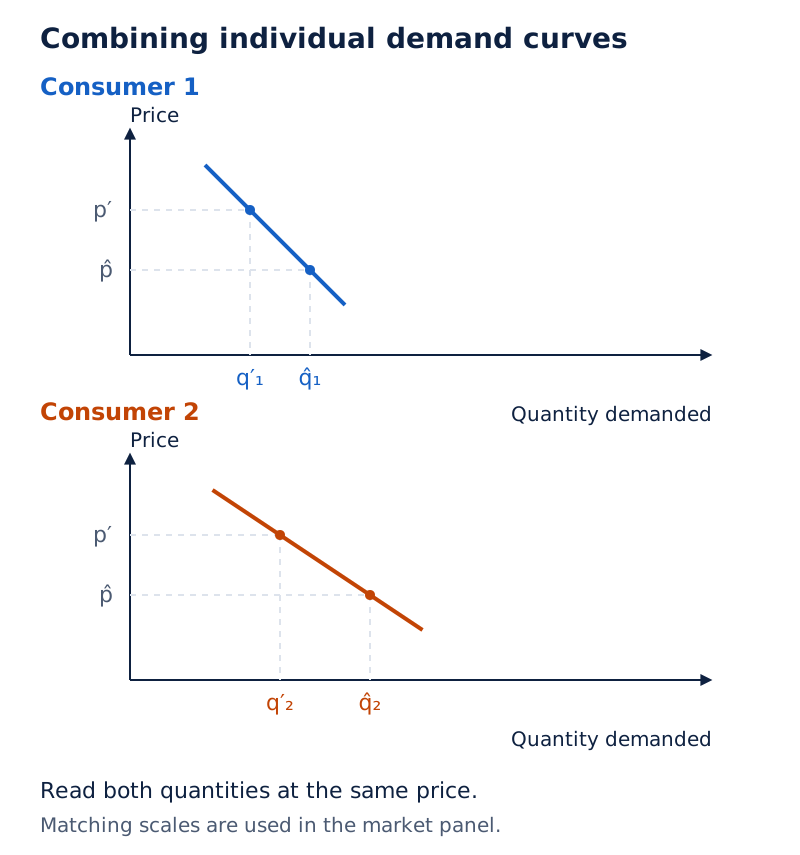
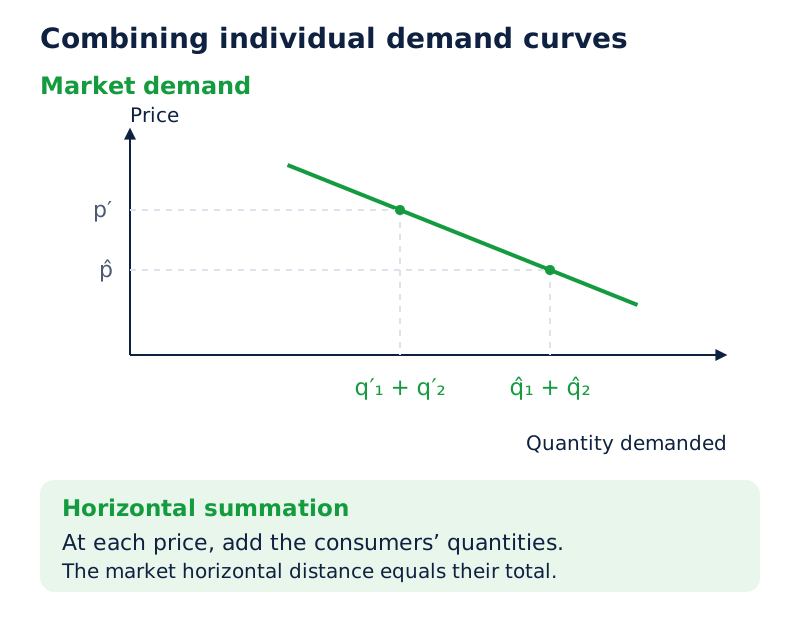
Three panels show downward-sloping lines with price on the vertical axes and quantity on the horizontal axes. Horizontal guide lines mark common prices. The third panel labels quantities as sums of the quantities in the first two panels.
Drawn by One Young India.
Changes in individual demand feed into market demand through the same addition. If one consumer wants more at a given price and the quantities wanted by the others remain unchanged, market demand at that price increases by the additional quantity.
This is different from moving along the existing market demand curve. A change in the good's own price requires reading a different row of the market schedule. A change in the number of buyers or in their demand conditions requires constructing a changed schedule.
What are exceptions and apparent exceptions to the law of demand?
The law of demand is a conditional relationship. To identify an exception, distinguish an unusual response to a good's own price from a change caused by income, preferences or expectations. A price rise occurring alongside higher purchases does not by itself establish an exception.
Why can a Giffen good have an upward price-demand relationship?
A Giffen good is a good for which the opposing income effect is stronger than the substitution effect, so quantity demanded and its own price move in the same direction. It is a special case associated with inferior goods.
A rise in purchasing power can sometimes cause a consumer to reduce consumption of a good. For such a good, the income and substitution effects work in opposite directions. If the substitution effect is stronger, demand and price remain inversely related.
If the income effect is stronger, demand is positively related to price. Consequently, an inferior good is not necessarily a Giffen good. The word inferior describes the response to income; Giffen describes a particular response to the good's own price.
How can prestige and expectations affect buying?
Prestige demand concerns purchases valued partly for the status associated with a high price. A higher price can make such a good more desirable to some buyers. This is commonly discussed as an exception because price can affect the attraction of the good itself.
Price expectations are beliefs about future prices. If buyers expect further price rises, they may increase current purchases even while the current price rises. Expectations have then changed, so the other-things-equal condition is not satisfied.
Use these explanations carefully. A Giffen response concerns opposing effects of a price change; prestige concerns what buyers value; expectations concern anticipated future conditions. Treating every observed increase in both price and purchases as the same phenomenon would conceal these differences.
What is price elasticity of demand, and how is it measured?
Price elasticity of demand measures how responsive quantity demanded is to a change in the good's own price. The law of demand describes the direction of change. Elasticity compares the size of the percentage quantity change with the percentage price change.
What do the symbols in the percentage method mean?
Let Q mean the original quantity demanded and P the original price. The symbol Δ means change, calculated as new value minus original value. Thus ΔQ means change in quantity and ΔP means change in price.
In the following change formulas, Q₁ and P₁ are the original quantity and price, while Q₂ and P₂ are the new quantity and price. The subscripts distinguish the original and new observations.
ΔQ = Q₂ − Q₁
ΔP = P₂ − P₁
A percentage change is the change divided by the original value, multiplied by 100. The symbol % means per cent. Calculate the quantity percentage from the original quantity and the price percentage from the original price.
Let eD denote signed price elasticity of demand. Then eD equals percentage change in quantity demanded divided by percentage change in price. Cancelling the common multiplication by 100 gives:
eD = (ΔQ / Q) × (P / ΔP)
The symbol / means division and × means multiplication. For a downward-sloping demand relationship, the signed elasticity is negative. Classification uses its absolute value, meaning its size without the negative sign. Elastic demand has an absolute value above one; inelastic demand has an absolute value below one. Elasticity has no unit.
Worked example 1. A consumer buys 15 bananas at Rs. 5 each and 12 bananas at Rs. 7 each. Find the percentage changes and interpret the demand response.
Answer: Quantity changes by (12 − 15) / 15 × 100 = −20%. Price changes by (7 − 5) / 5 × 100 = 40%. Signed elasticity is −20 / 40 = −0.5; its absolute value is 0.5, so demand is inelastic.
The original values are essential denominators. Dividing the change in bananas by the original price would mix quantities and money and would not measure a percentage quantity change.
Which degrees and determinants of demand elasticity should be distinguished?
The degree of elasticity describes the relative responsiveness of demand. Here comparisons use the absolute value of eD, already defined as the magnitude of price elasticity of demand. A larger value means a larger percentage response of quantity to a given percentage price change.
| Degree | Elasticity magnitude | Meaning |
|---|---|---|
| Perfectly inelastic | Zero | Quantity does not respond to a change in price. |
| Relatively inelastic | Greater than zero but less than one | The percentage quantity response is smaller than the percentage price change. |
| Unitary elastic | One | The percentage responses are equal in magnitude. |
| Relatively elastic | Greater than one | The percentage quantity response is larger than the percentage price change. |
| Perfectly elastic | Infinite | The limiting case represented by a horizontal demand curve at a given price. |
Infinite describes an unbounded value, rather than an ordinary finite number. A perfectly inelastic demand curve is vertical. A perfectly elastic demand curve is horizontal. These are limiting cases, distinct from demand that is merely less or more responsive.
Why do the nature of a good and substitutes matter?
A necessity is a good essential for life, such as food. A luxury is a good whose consumption is less essential. In general, demand for a necessity is likely to be price inelastic, while demand for a luxury is likely to be price elastic.
Close substitutes give consumers alternatives when a price rises. A particular variety of pulses can face more elastic demand than food as a whole, because buyers can switch to another variety. Demand is likely to be elastic when close substitutes are easily available.
If close substitutes are not easily available, demand is likely to be inelastic. Essential goods are often found to have inelastic demand. These qualifications matter: neither a necessity nor a luxury should be assigned an unchanging elasticity merely from its label.
Worked example 2. Quantity demanded falls from 25 units to 20 units when price rises from Rs. 4 to Rs. 5. Use the original values to classify elasticity.
Answer: Quantity changes by (20 − 25) / 25 × 100 = −20%. Price changes by (5 − 4) / 4 × 100 = 25%. The absolute elasticity is 20 / 25 = 0.8, so the response is relatively inelastic.
The same good may have elastic, unitary elastic and inelastic demand at different prices. A downward-sloping straight demand curve does not have the same elasticity at every point, even though its slope, meaning the change in price per unit change in quantity along the plotted line, is constant.
What are supply, supply schedules and the law of supply?
Supply is the quantity of a good that sellers are willing and able to offer for sale at a given price during a specified period. A firm is a producing business. Individual supply refers to one firm; market supply combines all firms' supplies.
How does supply differ from stock?
Stock means the quantity of a good held at a particular time. Supply refers to the quantity offered for sale during a period at a stated price. Holding goods does not imply offering the entire holding for sale immediately.
A supply schedule lists quantities supplied at alternative prices under unchanged supply conditions. A supply curve plots these combinations with price vertically and quantity supplied horizontally. Compare schedules only when their quantities refer to the same good and period.
Definition: The law of supply states that, other things remaining the same, a higher price leads to a larger quantity supplied and a lower price to a smaller quantity supplied. The usual supply curve therefore slopes upward.
The unchanged conditions include production technology and input prices. Technology means the methods used to transform inputs into output. Input prices are the amounts paid for resources used in production. A price change for the finished good differs from a change in its production costs.
What does a market supply schedule look like?
| Price per cricket ball | Total quantity produced and supplied |
|---|---|
| Rs. 10 | 200 cricket balls |
| Rs. 30 | 1,000 cricket balls |
This illustrative schedule associates the higher price with the larger quantity supplied. Each row gives a market total at one price. It does not state the output of each firm or imply that the firms contribute equal quantities.
The schedule also does not establish how a change in technology would affect supply. That requires a comparison between different supply conditions, rather than a comparison between two prices within the same schedule.
How do movements, shifts and determinants of supply fit together?
A change in the good's own price, with supply conditions constant, causes a movement along the supply curve. A change in another determinant changes the quantity supplied at each price and shifts the curve. Start by identifying which price or condition has changed.
How are the four supply changes distinguished?
| Change | Cause | Graphical result |
|---|---|---|
| Extension of supply | Own price rises | Upward movement along the same curve |
| Contraction of supply | Own price falls | Downward movement along the same curve |
| Increase in supply | More is offered at each price after another determinant changes | Rightward shift |
| Decrease in supply | Less is offered at each price after another determinant changes | Leftward shift |
Technological progress can allow the same inputs to produce more output, or fewer inputs to produce a given output. This is expected to lower the extra cost of producing another unit and shifts the firm's supply curve to the right.
A rise in an input price, such as the wage paid for labour, raises production cost. This is usually accompanied by a rise in the additional cost of producing another unit. The supply curve shifts leftward, with less supplied at each market price.
How does a tax on output affect supply?
A unit tax is a tax charged per unit of output sold. It adds to the seller's cost for each unit. In the long run, when the firm can adjust all its inputs, such a tax shifts its supply curve leftward.
Worked example 3. A government charges a unit tax of Rs. 2. A firm produces and sells 10 units. Find the total tax paid.
Answer: Total tax is 10 × Rs. 2 = Rs. 20. Each unit sold adds Rs. 2 to the tax bill, increasing the cost associated with supplying the output.
What the figure shows
Supply and a unit tax
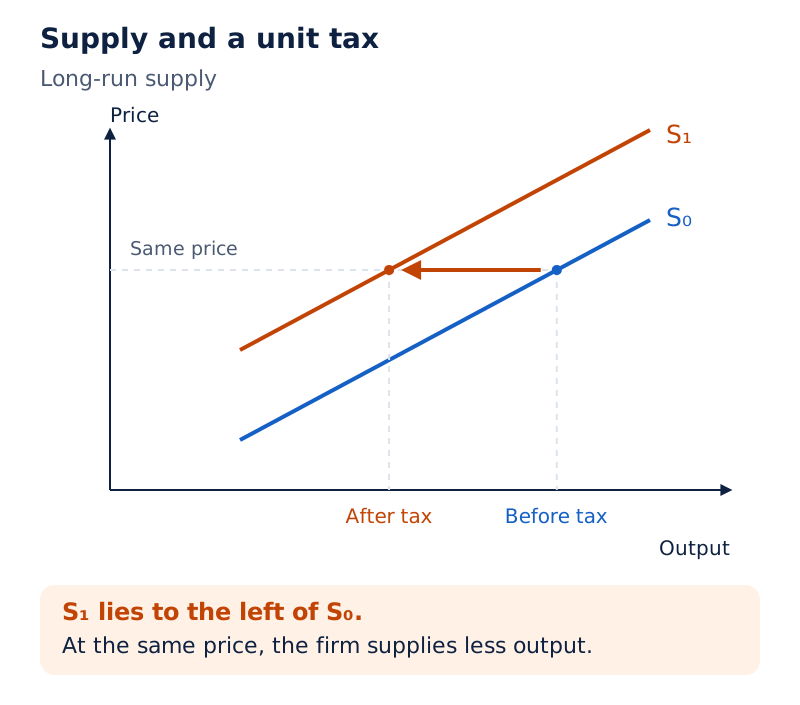
Price is vertical and output horizontal. Two upward-sloping supply curves are labelled S₀ and S₁, meaning supply before and after the tax. The after-tax curve lies to the left of the original curve.
Drawn by One Young India.
Do not confuse the tax-induced shift with an extension of supply. The shift compares quantities at the same market price under changed costs. Extension compares quantities at different prices under unchanged supply conditions.
How is market supply constructed, and what changes its position?
Market supply is the total quantity supplied by all firms at a particular market price. Its curve is obtained through horizontal summation of individual supply curves. Each total uses a common price, just as market demand combines buyers' quantities at a common price.
What steps produce the market supply schedule?
- Select one market price and read each firm's quantity supplied at that price.
- Include a zero quantity for any firm supplying nothing at that price.
- Add the firms' quantities to obtain total market supply at the chosen price.
- Repeat at other prices and plot the resulting market price-quantity combinations.
Firms can have different production costs. One firm may supply output at a price at which another supplies nothing. Market supply can therefore coincide with one firm's supply over part of the price range, then include additional firms at higher prices.
What the figure shows
Market supply from individual firms
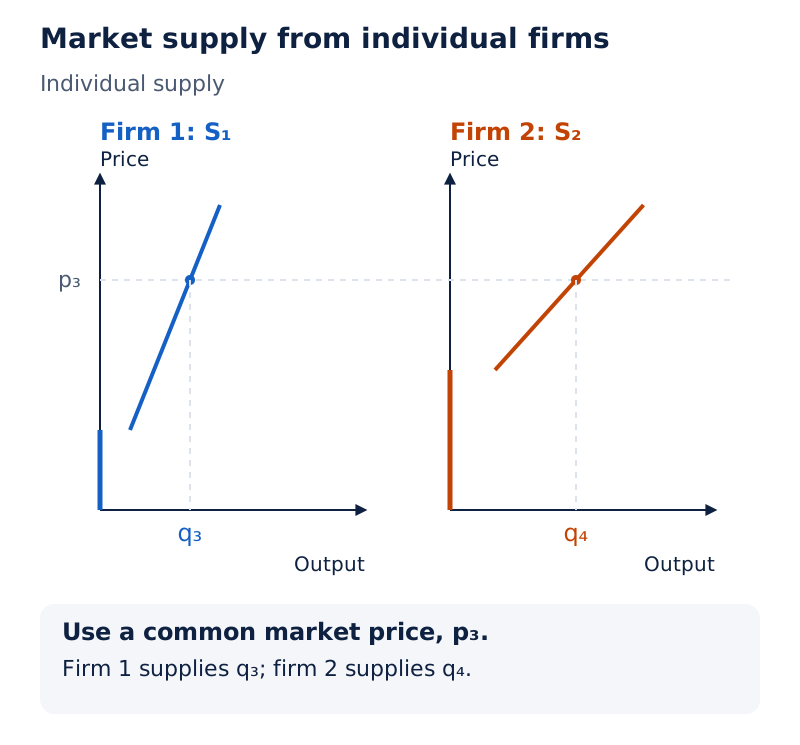
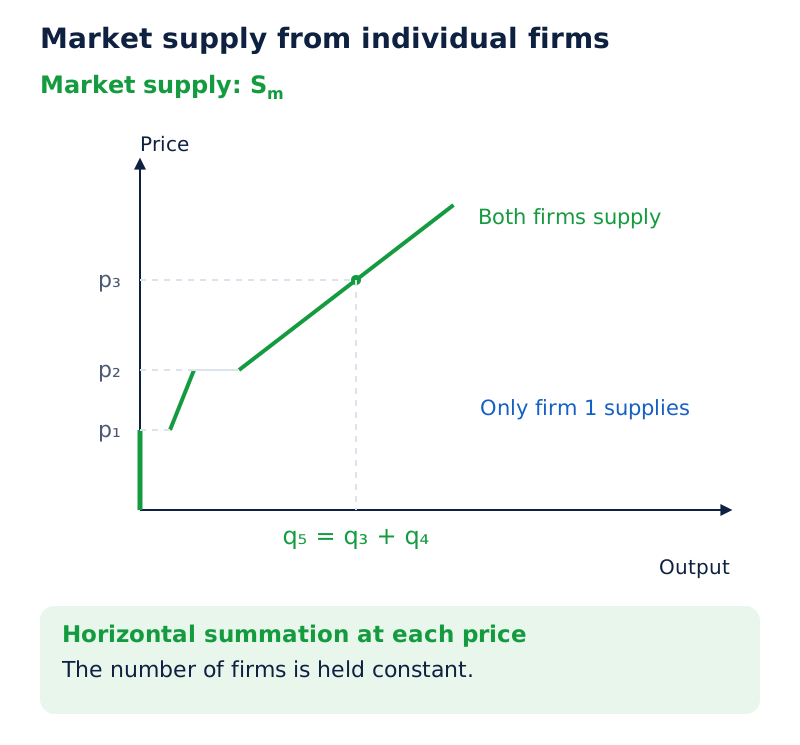
Three panels show supply curves labelled S₁, S₂ and Sₘ, meaning the first firm's supply, the second firm's supply and market supply. Common horizontal price lines cross the panels. The market curve combines the firms' horizontal output distances.
Drawn by One Young India.
Why does the number of firms matter?
The initial market supply curve assumes a fixed number of firms. If the number increases, market supply shifts rightward; if the number decreases, it shifts leftward. This changes the market total even without requiring an identical change in every existing firm's supply.
Changes in technology, input prices or taxes can also change individual supplies and hence the total. To explain a market shift, identify the changed condition and then show how it changes quantities offered at a common price.
Individual and market supply thus use the same price-quantity method but have different coverage. Neither curve is obtained by adding prices, and neither requires every producer to have identical costs, identical output or an identical supply curve.
How is supply elasticity measured, classified and affected by production conditions?
Price elasticity of supply measures the responsiveness of quantity supplied to a change in the good's own price. Let eS denote this elasticity. In this supply calculation, Q is the original quantity supplied, ΔQ its change, P the original price and ΔP its change.
eS = (ΔQ / Q) × (P / ΔP)
Equivalently, divide percentage change in quantity supplied by percentage change in price. For an upward-sloping supply relationship the value is positive, because price and quantity change in the same direction. Like demand elasticity, supply elasticity is independent of the units of measurement.
Worked example 4. The price of a cricket ball rises from Rs. 10 to Rs. 30, and total quantity supplied rises from 200 to 1,000 balls. Calculate supply elasticity using the original values.
Answer: Quantity increases by (1,000 − 200) / 200 × 100 = 400%. Price increases by (30 − 10) / 10 × 100 = 200%. Supply elasticity is 400 / 200 = 2, so supply is relatively elastic.
What are the degrees of supply elasticity?
| Degree | Value | Meaning |
|---|---|---|
| Perfectly inelastic | Zero | Quantity supplied does not change when price changes; the curve is vertical. |
| Relatively inelastic | Between zero and one | The percentage quantity change is smaller than the percentage price change. |
| Unitary elastic | One | The two percentage changes are equal. |
| Relatively elastic | Greater than one | The percentage quantity change exceeds the percentage price change. |
| Perfectly elastic | Infinite | The limiting case represented by a horizontal supply curve at a given price. |
Which conditions make supply more or less responsive?
- Time available: Producers generally have more opportunity to adjust output over a longer period. An immediate response can be restricted even when a later expansion is possible.
- Spare capacity: Unused productive capacity can allow output to expand more readily when price rises. Fully used capacity restricts that response.
- Availability of inputs: Easily obtained resources make expansion easier. Scarcity of necessary inputs can limit how far quantity supplied responds.
- Storage and perishability: Goods that can be stored allow sellers more flexibility over when to offer them. Perishable goods, which deteriorate during storage, offer less flexibility.
- Production time: A lengthy production process limits rapid increases in output. A shorter process can permit a quicker response to changed prices.
These factors explain responsiveness to price. They must be distinguished from the direction of a shift: an increase in supply means more offered at each price, whereas elastic supply means a relatively large percentage quantity response to a price change.
Glossary
- Demand — Quantity a consumer is willing and able to buy at a given price during a specified period.
- Demand schedule — A list showing quantities demanded at different prices under unchanged conditions.
- Market demand — The total quantity demanded by all consumers at a common price.
- Normal good — A good whose demand increases with income and decreases when income falls.
- Inferior good — A good whose demand falls as income rises, with other conditions unchanged.
- Substitutes — Goods that consumers can use in place of one another.
- Complements — Goods consumed together, linking demand for one with the price of another.
- Giffen good — A good whose opposing income effect exceeds its substitution effect, producing a positive own-price relationship.
- Supply — Quantity sellers are willing and able to offer at a given price during a period.
- Stock — The quantity of a good held at a particular point in time.
- Horizontal summation — Adding individual quantities at a common price to obtain a market total.
- Price elasticity — Responsiveness measured by percentage quantity change divided by percentage change in the good's own price.
- Unit tax — A tax imposed by the government per unit of output sold.
- Marginal utility — The additional satisfaction obtained from consuming one more unit of a commodity.
Common errors and misconceptions
- Misconception: Wanting a good is enough to create demand. Correct: Demand requires both willingness to buy and the ability to afford the good.
- Misconception: Every increase in quantity demanded is a rightward shift. Correct: A fall in the good's own price causes extension along the existing curve, other things unchanged.
- Misconception: Income growth raises demand for every good. Correct: Normal and inferior goods have opposite income relationships; identify the nature of the good first.
- Misconception: Every inferior good is a Giffen good. Correct: The opposing income effect must exceed the substitution effect for a Giffen response.
- Misconception: A negative demand elasticity means inelastic demand. Correct: The sign indicates direction. Compare the absolute value with one to classify responsiveness.
- Misconception: Market curves are obtained by adding prices. Correct: Add individual quantities at the same price, using horizontal summation.
- Misconception: A higher production cost extends supply. Correct: A cost increase can shift supply leftward; extension results from a rise in the good's own price.
- Misconception: Stock and supply mean the same thing. Correct: Stock is a holding at a point in time; supply concerns quantities offered at a price during a period.
Exam-style questions with model answers
Q1. Define demand and explain why a desire for a good alone does not constitute demand. [2 marks]
- Demand is the quantity a consumer is willing and able to buy at a given price during a specified period.
- A desire alone is insufficient because the consumer must also be willing to purchase and have the ability to pay.
Q2. State the law of demand and explain two conditions held constant when applying it. [3 marks]
- The law of demand states that quantity demanded rises when the good's own price falls and falls when its price rises, other things remaining the same.
- The consumer's income is held constant, so a change in available income does not independently alter the quantity chosen.
- Tastes and preferences are held constant, so the observed change concerns the good's price rather than a change in how desirable consumers find it.
Q3. Tea and coffee are substitutes. Coffee becomes dearer while the price of tea, consumers' incomes and their preferences remain unchanged. Explain the likely effect on tea demand, name the curve change, and distinguish it from extension of demand. [3 marks]
- Consumers can switch from coffee to tea, so consumption of tea is likely to rise as coffee becomes more expensive relative to tea.
- This is an increase in demand for tea, represented by a rightward shift: more tea is wanted at its unchanged price.
- Extension would result from a fall in tea's own price and would be a movement along the same demand curve. Tea's price has not fallen here.
Q4. Explain how the income and substitution effects distinguish a Giffen good from an inferior good that obeys the law of demand. Give four separate points. [4 marks]
- An inferior good is identified by its income response: demand falls when the consumer's income rises, with other conditions unchanged.
- A fall in its price makes it relatively cheaper, so the substitution effect encourages the consumer to buy more of it.
- The increase in purchasing power can reduce demand for the inferior good. If this opposing income effect is weaker, the substitution effect preserves the inverse price-demand relationship.
- For a Giffen good, the opposing income effect is stronger. Quantity demanded then moves in the same direction as its own price.
Q5. Define price elasticity of demand, describe the percentage method, explain the sign convention, and distinguish elastic from inelastic demand. Give five separate points without a numerical calculation. [5 marks]
- Price elasticity of demand measures the responsiveness of quantity demanded to a change in the good's own price. It compares percentage changes rather than absolute changes in different units.
- The percentage method divides percentage change in quantity demanded by percentage change in price. Each percentage change uses the original value of the relevant variable.
- For a downward-sloping demand relationship, the signed result is negative because price and quantity move in opposite directions. Classification uses the absolute value.
- Demand is relatively elastic when the absolute value exceeds one: the percentage response of quantity is greater than the percentage price change.
- Demand is relatively inelastic when the absolute value is below one but above zero: the percentage response of quantity is smaller than the percentage price change.
Q6. A firm faces a rise in the wage paid for labour. Its product's market price and its production technology remain unchanged. Explain the effect on production cost and supply, and distinguish this change from contraction of supply. [3 marks]
- Labour is an input, so the higher wage raises the firm's production cost. This is usually accompanied by a rise in the additional cost of producing another unit.
- The firm's supply curve shifts leftward, with fewer units supplied at the unchanged market price. This is a decrease in supply.
- Contraction of supply would be movement along an unchanged supply curve caused by a fall in the product's own price. That price has remained constant here.
Q7. Explain how market supply is constructed from individual supply and how an increase in the number of firms changes it. Give five separate points. [5 marks]
- Market supply is the total output offered by all firms at a common market price. Individual supply records the output offered by one firm.
- To obtain the total at a selected price, read the quantity supplied by every firm at that price. Include zero for firms supplying nothing.
- Add these quantities horizontally, because quantity is measured on the horizontal axis. Adding prices would not produce the quantity supplied to the market.
- Repeat the process at other prices to obtain the market schedule and curve. The firms need not have identical costs or identical individual supplies.
- The constructed curve assumes a fixed number of firms. An increase in the number of firms shifts market supply to the right, adding output at given prices.
Q8. Explain three factors that affect how readily producers can increase quantity supplied after a rise in the good's price. [3 marks]
- Time available matters: a longer adjustment period generally gives producers more opportunity to expand output than an immediate response allows.
- Spare capacity matters: unused productive capacity can be brought into operation more readily, whereas fully used capacity restricts an increase in production.
- Input availability matters: readily obtainable resources make expansion easier, while scarcity of necessary resources limits the quantity response even when a higher price encourages expansion.
Key takeaways
- Demand requires willingness and ability to buy; individual and market demand differ in the number of consumers covered.
- The law of demand holds other influences constant and describes an inverse relationship between own price and quantity demanded.
- Own-price changes cause movements along curves; changes in other determinants cause shifts of the whole price-quantity relationship.
- Normal and inferior goods respond differently to income, while substitutes and complements link demand to another good's price.
- Giffen behaviour requires the opposing income effect to exceed the substitution effect; inferiority alone does not establish it.
- Elasticity compares percentage changes, has no unit, and distinguishes responsiveness from the direction of a relationship.
- Market demand and market supply are constructed by adding individual quantities horizontally at a common price.
- Supply responds to production conditions, while time, capacity, input availability and storage influence its responsiveness to price.
Test yourself
Why must a demand statement include more than a desire?
The consumer must be willing to purchase and able to afford the good at its stated price.
What stays unchanged during a movement along a demand curve?
The consumer's income, tastes and preferences, and prices of related goods remain unchanged while the good's own price changes.
What does a rightward shift of demand mean?
A larger quantity is demanded at each given price following a change in a determinant other than the good's own price.
Why is an inferior good not necessarily a Giffen good?
The substitution effect can be stronger than the opposing income effect, preserving the inverse relationship between price and quantity demanded.
What does the absolute value of demand elasticity measure?
It measures the size of the percentage quantity response relative to the percentage price change, without the negative sign.
How does a unit tax affect a firm's long-run supply curve?
It adds a cost per unit sold and shifts the supply curve leftward, reducing quantity supplied at a given market price.
Why are quantities added at the same price when constructing market supply?
Market supply measures the total offered at one common price, so quantities from different price levels cannot form that total.
How does elastic supply differ from an increase in supply?
Elastic supply means that an own-price change causes a proportionately larger change in quantity supplied, so eS is greater than one, with other supply conditions unchanged. An increase in supply means more offered at each price after another determinant changes, shifting the supply curve rightward.
Write about it
Turn a question from this chapter into a paper.
The Writing Studio has a structure guide, a rubric and citation tools for 15 formats, from essays to research papers. Drafting is free with an account. Learnacy Essential adds feedback from an AI writing coach and submission to The OYI Review.
Learnacy Essential is ₹1,499 for the year. Publication depends on review and is not guaranteed.