
International Trade in India | CBSE Class 12 Geography Notes
On this page
Watch & explore
Start with a few high-quality watches, then dive into the notes below.
International trade in India: growth and trade balance, changing exports and imports, trading regions, sea routes, the development of ports, major ports and their hinterlands, and the role of airports.
What is international trade, and how has India’s trade changed?
Definition: International trade is trade between countries. Exports are goods sent to other countries for sale; imports are goods bought from other countries.
International trade is mutually beneficial because no country is self-sufficient, meaning able to meet all its own needs. India’s international trade has changed substantially in its volume, composition and direction. These three aspects describe different features of the same trading activity.
What do volume, composition and direction mean?
Volume concerns the scale of trade. Composition concerns the commodities, or goods, being traded. Direction concerns the countries or regions with which trade takes place. A rise in trade value does not by itself identify either the goods involved or the trading partners.
India’s external trade was worth 1,214 crore rupees in 1950-51 and rose to 77,19,796 crore rupees in 2020-21. A crore means ten million. These are money values of trade, so they should not be read as quantities of cargo, meaning goods carried by a transport service.
Why did overseas trade expand?
The sharp increase was associated with momentum in manufacturing, liberal government policies and diversification of markets. Diversification of markets means extending trade across a wider range of markets. Manufacturing growth and changes in trading opportunities therefore belong together in an explanation of this expansion.
Both imports and exports increased in overall volume, but the value of imports continued to exceed exports. Growth in trade must therefore be distinguished from equality between the two flows. An expanding trade relationship can still have a larger import value than export value.
How should India’s trade balance and trade data be interpreted?
Trade balance is the value of exports minus the value of imports for the same period. A negative result means that imports exceed exports. This is a trade deficit. All figures in the following table are in crore rupees.
| Year | Exports | Imports | Trade balance |
|---|---|---|---|
| 2004-05 | 3,75,340 | 5,01,065 | −1,25,725 |
| 2009-10 | 8,45,534 | 13,63,736 | −5,18,202 |
| 2013-14 | 19,05,011 | 27,15,434 | −8,10,423 |
| 2016-17 | 18,52,340 | 25,77,422 | −7,25,082 |
The minus sign, −, indicates a negative balance. For example, subtracting imports of 5,01,065 crore rupees from exports of 3,75,340 crore rupees gives a deficit of 1,25,725 crore rupees in 2004-05.
Does long-term growth mean an increase in every year?
No. Exports and imports were both lower in 2016-17 than in 2013-14 in these selected observations. The deficit also became smaller between those observations. The broad growth of foreign trade should not be converted into a claim that every figure increased continuously.
What the figure shows
Gap between exports and imports
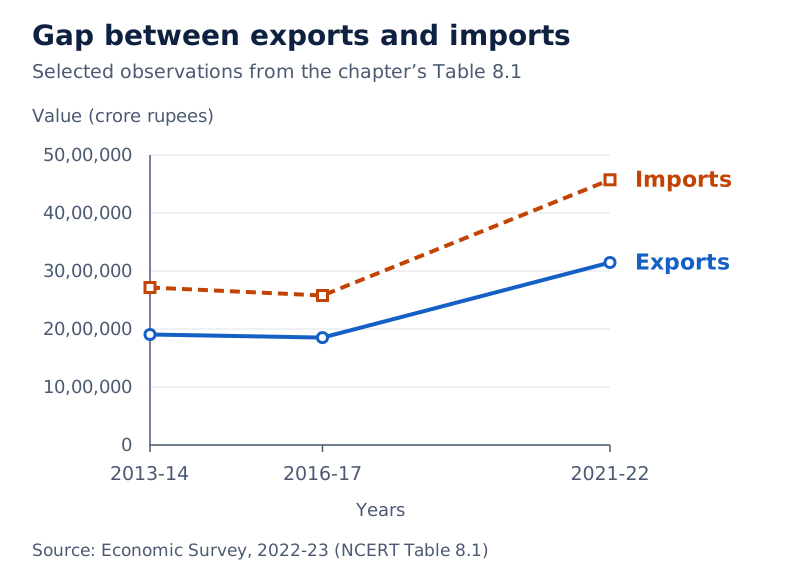
Two lines distinguish exports from imports. Years appear on the horizontal axis and values in crore rupees on the vertical axis. The imports line stays above the exports line at the plotted observations.
Drawn by One Young India. See Fig. 8.1 in your NCERT textbook
Value and percentage share answer different questions. Value measures the money worth of a category; percentage share measures its part in a total expressed out of one hundred. A category’s share can fall without the share alone proving that its money value fell.
How has the composition of India’s exports changed?
India exports agricultural and allied products, ores and minerals, manufactured goods, crude and petroleum products, and other commodities. Allied products are products grouped with agriculture because of related activities. Manufactured goods are goods produced through manufacturing rather than exported simply as raw materials.
The table gives each group’s percentage share in exports. A share describes the composition of exports within that year. It is not the percentage growth rate of the group between two years.
| Commodity group | 2015-16 share, per cent | 2016-17 share, per cent | 2020-21 share, per cent | 2021-22 share, per cent |
|---|---|---|---|---|
| Agriculture and allied products | 12.6 | 12.3 | 14.3 | 11.9 |
| Ores and minerals | 1.6 | 1.9 | 3.2 | 2.0 |
| Manufactured goods | 72.9 | 73.6 | 71.2 | 67.8 |
| Crude and petroleum products | 11.9 | 11.7 | 9.2 | 16.4 |
| Other commodities | 1.1 | 0.5 | 2.1 | 1.9 |
Which broad shifts are visible?
Between 2015-16 and 2021-22, the shares of agriculture and allied products and manufactured goods decreased. The shares of crude petroleum and products and other commodities increased. The share of ores and minerals largely remained constant over these years.
That broad description of ores and minerals does not mean identical annual figures. Their share was 1.6 per cent in 2015-16, reached 3.2 per cent in 2020-21 and stood at 2.0 per cent in 2021-22.
How did individual export groups perform?
The decline in traditional items was largely due to tough international competition. Cashew exports declined, while floricultural products, meaning flowers and related products, fresh fruits, marine products and sugar registered increases. Marine products are products obtained from the sea.
Manufacturing alone accounted for 67.8 per cent of total export value in 2021-22. Engineering goods showed significant export growth. China and other East Asian countries were major competitors. Gems and jewellery also contributed a larger share of India’s foreign trade.
Selected export values for 2021-22 were 3,75,742 crore rupees for agriculture and allied products, 63,754 crore rupees for ores and minerals, and 21,32,296 crore rupees for manufactured goods. Mineral fuels and lubricants accounted for 5,15,310 crore rupees; lubricants reduce friction in machinery.
Why did India’s import composition change?
India faced serious food shortages during the 1950s and 1960s. Major imports included foodgrain, capital goods, machinery and equipment. Capital goods are goods used to produce other goods. Import substitution means producing domestically goods that would otherwise be imported.
Despite efforts at import substitution, imports exceeded exports. The balance of payments, the record of economic transactions with other countries, was adverse in this setting. The changing import basket subsequently reflected shifts in food supply, energy requirements and industrial activity.
What sequence explains the shift?
- Serious food shortages in the 1950s and 1960s made foodgrain an important import, alongside capital goods, machinery and equipment.
- After the 1970s, foodgrain imports were discontinued due to the success of the Green Revolution, the agricultural production increase associated with improved farming methods.
- The energy crisis of 1973 pushed up petroleum prices and also increased the import budget.
- Fertilisers and petroleum replaced foodgrain in the changing import pattern. Machinery and equipment, special steel, edible oil and chemicals largely made up the import basket.
What do the selected import shares show?
Petroleum is used both as fuel and as an industrial raw material, meaning an input used to make other products. Rising petroleum imports indicate the tempo of industrialisation and better living standards. Sporadic, or occasional, international price rises are another reason.
| Commodity group | 2015-16 share, per cent | 2016-17 share, per cent | 2020-21 share, per cent | 2021-22 share, per cent |
|---|---|---|---|---|
| Food and allied products | 5.1 | 5.6 | 4.5 | 4.4 |
| Fuel: coal, petroleum, oil and lubricants | 25.4 | 26.7 | 25.1 | 31.6 |
| Fertilisers | 2.1 | 1.3 | 1.9 | 2.3 |
| Paper board manufacturing and newsprint | 0.8 | 0.9 | 0.8 | 0.7 |
| Capital goods | 13.0 | 13.6 | 12.7 | 10.1 |
| Others | 38.1 | 37.0 | 41.6 | 38.5 |
The fuel share was higher in 2021-22 than in 2015-16, while the shares of food and allied products and capital goods were lower. The listed observations nevertheless show intervening fluctuations, so endpoint comparisons should not be treated as uninterrupted annual movements.
Other important imports included pearls, precious and semi-precious stones, gold, silver and non-ferrous metals, meaning metals other than iron. Edible oils are oils suitable for eating. These items show that imports extend beyond foodgrain, industrial machinery and energy supplies.
Note: The import-share table presents selected groups. Do not assume that these displayed rows constitute a complete distribution adding to one hundred, or invent a missing category to complete it.
What do principal imports and trading regions reveal?
The values of selected principal imports help identify which listed categories accounted for larger import expenditure. They complement percentage-share data but use a different measure: crore rupees rather than a share out of one hundred.
| Selected import category | 2021-22 value, crore rupees |
|---|---|
| Petroleum, oil and lubricants | 12,07,803 |
| Non-ferrous metals | 4,99,766 |
| Chemical products | 3,08,882 |
| Pearls, precious and semi-precious stones | 2,31,279 |
| Edible oils | 1,41,532 |
| Fertilisers and fertiliser manufacturing | 1,05,796 |
| Iron and steel | 94,053 |
| Medicinal and pharmaceutical products | 67,545 |
| Pulp and waste paper | 11,934 |
Among these listed categories, petroleum, oil and lubricants had the highest value. Non-ferrous metals, chemical products, pearls and precious and semi-precious stones, and edible oils followed. This ranking applies to the categories displayed, rather than to an invented expanded list.
Which regions supplied India’s imports?
India has trade relations with most countries and major trading blocs, or groups of countries associated for trade. ASEAN means the Association of Southeast Asian Nations. The regional table combines Asia and ASEAN as one heading.
| Region | 2016-17 imports, crore rupees | 2021-22 imports, crore rupees |
|---|---|---|
| Europe | 4,03,972 | 6,40,577 |
| Africa | 1,93,327 | 3,68,156 |
| North America | 1,95,332 | 3,78,041 |
| Latin America | 1,15,762 | 1,61,995 |
| Asia and ASEAN | 15,44,520 | 29,18,577 |
Asia and ASEAN supplied the largest import value among the listed regions in both years. Every displayed regional value was higher in 2021-22 than in 2016-17. These figures concern imports; they do not give export values or a regional trade balance.
Which measures supported wider international trade?
Measures included import liberalisation, meaning easing import restrictions; reduction in import duties, the taxes on imported goods; delicensing, meaning removal of licensing requirements; and a change from process patents to product patents. Patents protect inventions: process patents concern methods, while product patents concern products.
Most foreign trade travels by sea and air. A small portion also uses land routes to neighbouring countries such as Nepal, Bhutan, Bangladesh and Pakistan. Thus, the geographical direction of trade and its transport route are related but distinct aspects.
How did sea ports become gateways of international trade?
A port is a place where goods are loaded onto or unloaded from ships. A harbour is a sheltered water area where ships can anchor. A port’s hinterland is the inland area it serves through trade connections.
India is surrounded by sea on three sides and has a long coastline. Water provides a smooth surface for very cheap transport provided there is no turbulence, meaning disturbed water movement. India has a long seafaring tradition, reflected in place names ending in pattan, meaning port.
How did colonial trade reshape ports?
Ports became important international gateways after European traders arrived and British colonisation developed. Their sizes and areas of influence varied. The British used ports as suction points for resources from their hinterlands. Railways extended the connections towards the interior.
- Railway extension connected local markets with regional markets.
- Regional markets became linked with national markets.
- National markets connected with international markets through the ports.
- This pattern of drawing resources from the interior towards overseas trade continued until 1947.
Partition transferred Karachi to Pakistan and Chittagong to the former East Pakistan, now Bangladesh. Kandla in the west and Diamond Harbour near Kolkata on the Hugli river were developed to compensate for the loss of these important ports.
Who regulates ports, and how did capacity grow?
Major ports have policy and regulatory functions decided by the central government. State governments regulate the policy and functions of minor ports. Major ports handle a larger share of total traffic. These are administrative distinctions as well as differences in their trading role.
Most ports are equipped with modern infrastructure. Private entrepreneurs were invited to participate in modernisation as functions increased and ports needed facilities comparable with international ports. Cargo-handling capacity rose from 20 million tonnes in 1951 to more than 837 million tonnes in 2016.
Cargo means goods carried by a transport service; a tonne is a unit of mass equal to one thousand kilograms. Capacity measures the amount that ports can handle, so it should be distinguished from the monetary value of the goods traded.
What are the main features of ports on India’s west coast?
The west coast has more ports than the east coast. Their functions differ according to location, cargo and inland connections. A natural harbour, meaning a naturally sheltered place for ships to anchor, is a feature of Mumbai, Mormugao and Cochin.
Case study: How do Mumbai and Jawaharlal Nehru Port work together?
Mumbai is a natural harbour close to the general routes from the Middle East, Mediterranean countries, North Africa, North America and Europe. These routes connect it with regions accounting for a major share of India’s overseas trade.
Its port extends 20 kilometres in length and 6 to 10 kilometres in width, with 54 berths. A berth is a place where a ship is secured at a port. Mumbai also has the country’s largest oil terminal, a facility for handling oil cargo.
Madhya Pradesh, Maharashtra, Gujarat, Uttar Pradesh and parts of Rajasthan form its main hinterland. Jawaharlal Nehru Port at Nhava Sheva was developed as a satellite port to relieve pressure on Mumbai. A satellite port supports another port by taking part of its traffic.
Jawaharlal Nehru Port is India’s largest container port. Containers are large standardised boxes used to carry goods. The relationship between the two ports illustrates how additional facilities can reduce pressure on an established gateway without removing its role.
What distinguishes the other western ports?
Deendayal Port, also called Kandla port, lies at the head of the Gulf of Kuchchh. It serves western and north-western India and reduces pressure on Mumbai. It is specially designed to receive large quantities of petroleum, petroleum products and fertiliser.
The offshore terminal at Vadinar was developed to reduce pressure on Kandla. Offshore means situated away from the shore in the sea. This is another example of distributing cargo-handling work across associated facilities.
Mormugao lies at the entrance of the Zuari estuary in Goa. An estuary is the tidal mouth of a river. Remodelling in 1961 increased its significance for iron-ore exports to Japan. The Konkan railway considerably extended its hinterland.
Karnataka, Goa and southern Maharashtra constitute Mormugao’s hinterland. New Mangalore in Karnataka exports iron ore and iron concentrates, material in which the iron content has been increased. Karnataka is its major hinterland.
New Mangalore also handles fertilisers, petroleum products, edible oils, coffee, tea, wood pulp, yarn, granite stone and molasses. Wood pulp is fibrous material used in papermaking; yarn is thread used in textiles; molasses is syrup remaining after sugar extraction. Cochin, at the head of Vembanad Kayal, a backwater water body, is popularly known as the Queen of the Arabian Sea.
Cochin benefits from being close to the Suez-Colombo route. It serves Kerala, southern Karnataka and south-western Tamil Nadu. Its location and hinterland should be learnt together, just as Mormugao’s railway connection belongs with its inland reach.
What distinguishes India’s eastern ports and their hinterlands?
Eastern ports include river-based facilities, sheltered harbours and an artificial harbour, meaning one constructed through human intervention. Their profiles connect physical conditions with particular cargoes, inland areas and efforts to relieve congestion, or excessive crowding of traffic.
Case study: Why were Kolkata and Haldia developed together?
Shyama Prasad Mookerjee, Kolkata Port lies on the Hugli river, 128 kilometres inland from the Bay of Bengal. Developed by the British, it initially benefited from Kolkata’s position as the capital of British India.
Kolkata’s significance declined considerably as exports were diverted to Visakhapatnam, Paradwip and its satellite port, Haldia. Silt accumulation, the build-up of fine sediment, also creates difficulties in the Hugli river, which links the port with the sea.
Its hinterland includes Uttar Pradesh, Bihar, Jharkhand, West Bengal, Sikkim and the north-eastern states. Kolkata also provides port facilities to Nepal and Bhutan, neighbouring land-locked countries, meaning countries without a coastline.
Haldia lies 105 kilometres downstream from Kolkata and was constructed to reduce congestion there. It handles bulk cargo, or large quantities of unpackaged commodities, including iron ore, coal, petroleum, petroleum products and fertilisers, as well as jute, jute products, cotton and cotton yarn.
How do Paradwip and Visakhapatnam differ?
Paradwip is in the Mahanadi delta, about 100 kilometres from Cuttack. A delta is a depositional landform at a river mouth. Its deepest harbour is specially suited to very large vessels, and it was developed mainly for large-scale iron-ore exports.
Odisha, Chhattisgarh and Jharkhand form parts of Paradwip’s hinterland. Visakhapatnam, in Andhra Pradesh, is a land-locked harbour connected to the sea by a channel cut through solid rock and sand. Here land-locked describes an enclosed harbour with a sea connection.
Visakhapatnam’s outer harbour was developed for iron ore, petroleum and general cargo. Andhra Pradesh and Telangana are its main hinterland. The harbour’s physical enclosure must not be confused with the absence of sea access in a land-locked country.
Why were additional ports developed near Chennai?
Chennai is one of the oldest eastern ports. Its artificial harbour was built in 1859. Shallow coastal waters make it not much suitable for large ships. Tamil Nadu and Puducherry form its hinterland.
Kamarajar, or Ennore, was constructed 25 kilometres north of Chennai to relieve pressure on Chennai port. V.O. Chidambaranar, or Tuticorin, was also developed to relieve pressure on Chennai.
Tuticorin handles varied cargo, including coal, salt, foodgrains, edible oils, sugar, chemicals and petroleum products. These three ports illustrate how a major coastal trading centre can be supported by additional ports with their own cargo-handling functions.
How can maps help explain ports, routes and hinterlands?
A map connects a port’s name with its position, adjacent sea and route connections. Locate western ports beside the Arabian Sea and eastern ports beside the Bay of Bengal. Then connect the location with the named hinterland and cargo described in each port profile.
What the figure shows
India’s major ports and sea routes
Port symbols occur along both coasts, with sea-route lines extending across adjoining waters. Labels include Deendayal Port, Mumbai, Mormugao, Mangaluru, Cochin, Chennai, Paradwip, Haldia and Kolkata. The Arabian Sea and Bay of Bengal are named.
See Fig. 8.4 in your NCERT textbook
Why should hinterlands not be drawn as fixed divisions?
The boundary of a hinterland is difficult to demarcate because it is not fixed over space. In most cases, the hinterland of one port may overlap with another. Overlap means that areas served by different ports can partly coincide.
Mumbai’s inland reach includes several states, while Karnataka is the major hinterland of New Mangalore. Mormugao also serves Karnataka. These examples help connect the general idea of overlap with the named areas served by individual ports.
Use route lines to study connections and port symbols to identify locations. A sea-route map does not itself mark a precise, permanent inland boundary for every port. Keep the separate ideas of coastal position, overseas connection and inland service area clear.
What role do airports play in India’s international trade?
Air transport offers the least time for carriage and can handle high-value or perishable goods over long distances. Perishable goods are goods liable to spoil. This combination of speed, value and perishability explains its particular role in international trade.
What are its advantages and limitations?
Air transport is very costly and unsuitable for heavy and bulky commodities. These limitations reduce its participation in international trade compared with oceanic routes. Speed therefore does not mean that air transport is the preferred means for every type of cargo.
| Feature | Role in air trade |
|---|---|
| Time taken | Advantage of the least time for carriage |
| High-value or perishable goods | Handled over long distances |
| Transport cost | Very costly |
| Heavy and bulky commodities | Unsuitable for carriage by air |
The 2016-17 airport account listed 25 major airports: Ahmedabad, Bengaluru, Chennai, Delhi, Goa, Guwahati, Hyderabad, Kolkata, Mumbai, Thiruvananthapuram, Srinagar, Jaipur, Calicut, Nagpur, Coimbatore, Cochin, Lucknow, Pune, Chandigarh, Mangaluru, Visakhapatnam, Indore, Patna, Bhubaneswar and Kannur.
Read this as a dated airport list. Its year is part of the information, just as the year matters when using export shares or regional import values. The location of an airport and the type of cargo suited to air transport are separate points.
What does the air-route map show?
What the figure shows
India’s air routes
Lines connect named cities across India and extend towards overseas destinations. The legend distinguishes national airports from international airports. Delhi, Mumbai, Kolkata and Chennai appear where several route lines meet.
See Fig. 8.5 in your NCERT textbook
The map includes both inland and coastal centres. Follow the route connections while keeping the legend’s airport categories distinct. Sea and air together carry most foreign trade, while land routes account for a small portion linking neighbouring countries.
Glossary
- International trade — Trade between countries, connecting economies that cannot independently meet all their needs.
- Exports — Goods sent to other countries for sale as part of international trade.
- Imports — Goods bought from other countries to meet domestic requirements through international trade.
- Trade balance — The value of exports minus the value of imports during the same period.
- Trade deficit — A negative trade balance arising when the value of imports exceeds exports.
- Composition of trade — The mix of commodities making up a country’s imports or exports.
- Direction of trade — The countries or regions with which a country conducts its trade.
- Import substitution — Domestic production of goods that would otherwise be bought from other countries.
- Capital goods — Goods used in producing other goods rather than directly meeting consumption needs.
- Hinterland — The inland area served by a port, whose boundary can overlap another port’s hinterland.
- Harbour — A sheltered area of water in which ships can anchor.
- Satellite port — A supporting port developed to relieve pressure on an established port.
- Cargo — Goods carried by ships or other transport services between places.
- Perishable goods — Goods liable to spoil, for which rapid transport can be valuable.
Common errors and misconceptions
- Misconception: Expanding trade means exports must exceed imports. Correct: Both flows expanded overall, but India’s import value continued to exceed its export value.
- Misconception: A lower export share proves a lower export value. Correct: Share measures a category’s part in the total. Its money value requires separate value data.
- Misconception: The ores and minerals share was identical every year. Correct: It largely remained constant over the period, but the individual observations differed.
- Misconception: The regional trade table gives both exports and imports. Correct: It gives import values, so regional export values and balances cannot be calculated from it alone.
- Misconception: Hinterlands have fixed, mutually exclusive boundaries. Correct: Their boundaries are not fixed over space. In most cases, one port’s hinterland may overlap another’s.
- Misconception: A land-locked harbour cannot connect with the sea. Correct: Visakhapatnam is a land-locked harbour connected to the sea through a channel cut through rock and sand.
- Misconception: Air transport is suitable for heavy cargo because it is fast. Correct: Air transport is very costly and unsuitable for heavy and bulky commodities.
- Misconception: Water transport is cheap regardless of conditions. Correct: Water provides a smooth surface for very cheap transport provided there is no turbulence.
Exam-style questions with model answers
Q1. In 2004-05, exports were 3,75,340 crore rupees and imports were 5,01,065 crore rupees. Trade balance means exports minus imports. Calculate the balance and interpret its sign. [2 marks]
- The trade balance was 3,75,340 minus 5,01,065, giving −1,25,725 crore rupees.
- The negative sign indicates a trade deficit: imports exceeded exports by 1,25,725 crore rupees.
Q2. Export shares changed from 2015-16 to 2021-22 as follows: agriculture and allied products, 12.6 to 11.9 per cent; manufactured goods, 72.9 to 67.8 per cent; crude and petroleum products, 11.9 to 16.4 per cent. Compare the three changes. [3 marks]
- Agriculture and allied products fell from 12.6 to 11.9 per cent, so their share in the total export basket became smaller.
- Manufactured goods fell from 72.9 to 67.8 per cent, while remaining the largest of the three export categories given in the question.
- Crude and petroleum products rose from 11.9 to 16.4 per cent, increasing their share and contrasting with the declines in the other two categories.
Q3. India’s 2021-22 regional import values, in crore rupees, were: Europe 6,40,577; Africa 3,68,156; North America 3,78,041; Latin America 1,61,995; Asia and ASEAN 29,18,577. ASEAN means Association of Southeast Asian Nations. Identify the largest supplier group, compare North America with Africa, and state whether these data reveal export destinations. [3 marks]
- Asia and ASEAN formed the largest supplier group among the listed regions, with imports worth 29,18,577 crore rupees, exceeding each other regional value.
- North America supplied more than Africa: the respective import values were 3,78,041 crore rupees and 3,68,156 crore rupees.
- The data do not establish export destinations or export rankings because every figure supplied measures imports rather than exports.
Q4. Use these facts to explain five stages in India’s changing import pattern: food shortages in the 1950s and 1960s; imports of foodgrain, capital goods, machinery and equipment; discontinuation of foodgrain imports after the 1970s following the Green Revolution; the 1973 energy crisis raising petroleum prices and the import budget; replacement of foodgrain by fertilisers and petroleum. [5 marks]
- Serious food shortages in the 1950s and 1960s explain why food supply was an important concern in India’s import pattern during that period.
- Foodgrain was a major import alongside capital goods, machinery and equipment. The initial import basket therefore included both food requirements and production equipment.
- Following the success of the Green Revolution, foodgrain imports were discontinued after the 1970s, changing the earlier importance of foodgrain in imports.
- The energy crisis of 1973 raised petroleum prices. This increased the import budget, connecting the changing expenditure pattern with international energy prices.
- Fertilisers and petroleum replaced foodgrain in the changing import basket. The transition linked improved food production with a different set of import requirements.
Q5. Explain five features of Kolkata and Haldia, covering Kolkata’s river location and silt problem, the diversion of exports, Haldia’s role in relieving congestion, and Haldia’s cargo, using these facts: Kolkata lies on the Hugli, 128 kilometres inland; silt accumulates in the river; exports were diverted to Visakhapatnam, Paradwip and Haldia; Haldia is Kolkata’s satellite port, 105 kilometres downstream, built to reduce congestion; Haldia handles iron ore, coal, petroleum, petroleum products, fertilisers, jute, jute products, cotton and cotton yarn. [5 marks]
- Kolkata’s position on the Hugli, 128 kilometres inland, gives the river an essential connecting role between the port and the sea.
- Silt accumulation affects that river connection. The problem concerns the waterway through which Kolkata connects with the sea, making its river location significant.
- Diversion of exports to Visakhapatnam, Paradwip and Haldia reduced Kolkata’s significance. Haldia therefore belongs within the changing distribution of traffic among these ports.
- Haldia was built 105 kilometres downstream as a satellite port to reduce Kolkata’s congestion. Its supporting function explains the relationship between the two ports.
- Haldia handles iron ore, coal, petroleum, petroleum products, fertilisers, jute, jute products, cotton and cotton yarn, demonstrating the varied cargo handled by this supporting facility.
Q6. Explain how each facility relieves pressure, using these pairings: Deendayal Port serves western and north-western India and reduces pressure on Mumbai; Vadinar is an offshore terminal reducing pressure on Deendayal Port; Jawaharlal Nehru Port at Nhava Sheva is Mumbai’s satellite port; Kamarajar lies 25 kilometres north of Chennai and reduces pressure on Chennai. [4 marks]
- Deendayal Port takes a supporting role in western maritime trade by serving western and north-western India and reducing pressure on Mumbai.
- Vadinar reduces pressure on Deendayal Port through an offshore terminal, extending the cargo-handling facilities associated with that port.
- Jawaharlal Nehru Port at Nhava Sheva functions as Mumbai’s satellite port, taking traffic pressure away from the established port.
- Kamarajar was constructed 25 kilometres north of Chennai to relieve pressure on Chennai, providing another example of additional port development.
Q7. Air transport takes the least time for carriage, handles high-value or perishable goods over long distances, is very costly, and is unsuitable for heavy and bulky commodities. Use these facts to explain two advantages and two limitations. [4 marks]
- Its first advantage is speed: taking the least time for carriage makes air transport useful where the time spent moving goods matters.
- Its second advantage is the handling of high-value or perishable goods over long distances, linking cargo characteristics with rapid movement.
- Its first limitation is its very high cost, which restricts its usefulness as a general means of transporting traded commodities.
- Its second limitation is unsuitability for heavy and bulky commodities, so its speed does not make it appropriate for every cargo.
Q8. A port’s hinterland is the inland area it serves. Its boundary is not fixed over space, and in most cases one port’s hinterland may overlap another’s. Give two reasons why hinterlands should not be represented as permanent, separate divisions. [2 marks]
- The boundary is not fixed over space, so it should not be treated as permanent.
- In most cases, hinterlands may overlap, so different ports’ service areas need not be entirely separate.
Key takeaways
- India’s international trade changed in scale, commodity composition and geographical direction, while import value continued to exceed export value.
- Manufactured goods accounted for 67.8 per cent of export value in 2021-22, despite a lower share than in 2015-16.
- Food shortages shaped early imports; the Green Revolution and the 1973 energy crisis subsequently changed the import pattern.
- Petroleum serves as both fuel and industrial raw material, while occasional international price rises also affect import expenditure.
- Asia and ASEAN had the largest import value among the listed regions in both 2016-17 and 2021-22.
- Ports connect overseas routes with inland hinterlands, whose boundaries are not fixed and may overlap in most cases.
- Satellite ports and additional terminals relieve pressure on established ports, as illustrated by Mumbai, Kolkata and Chennai.
- Air transport offers speed for high-value or perishable goods but is costly and unsuitable for heavy, bulky commodities.
Test yourself
What three aspects describe changes in India’s international trade?
Volume describes its scale, composition describes the commodities traded, and direction describes its trading countries or regions.
Why did traditional export items decline?
The decline was largely due to tough international competition. Cashew was among the traditional agricultural exports that declined.
Why does petroleum matter beyond its use as fuel?
Petroleum is also an industrial raw material, connecting its imports with the tempo of industrialisation and better living standards.
How are major and minor ports regulated differently?
The central government decides policy and performs regulatory functions for major ports. State governments regulate the policy and functions of minor ports.
What extended Mormugao’s hinterland considerably?
Construction of the Konkan railway considerably extended Mormugao’s hinterland, which includes Karnataka, Goa and southern Maharashtra.
Which neighbouring land-locked countries use Kolkata’s port facilities?
Kolkata extends port facilities to Nepal and Bhutan, neighbouring countries that have no coastline.
Why is Chennai not much suitable for large ships?
The waters near Chennai’s coast are shallow, making its artificial harbour not much suitable for large ships.
What condition accompanies the description of water as a cheap transport surface?
Water provides a smooth surface for very cheap transport provided there is no turbulence.
Write about it
Turn a question from this chapter into a paper.
The Writing Studio has a structure guide, a rubric and citation tools for 15 formats, from essays to research papers. Drafting is free with an account. Learnacy Essential adds feedback from an AI writing coach and submission to The OYI Review.
Learnacy Essential is ₹1,499 for the year. Publication depends on review and is not guaranteed.