
Nobel Prize in Economics 2003: ARCH Volatility and Cointegration in Time Series
On this page
What was the Nobel Prize in Economics 2003 awarded for?
The Sveriges Riksbank Prize in Economic Sciences in Memory of Alfred Nobel for 2003 was given jointly to two economists for solving two separate but related problems in handling time series data, which are sequences of economic measurements recorded over time, such as monthly GDP or daily stock prices.
Robert F. Engle III received his half of the prize "for methods of analyzing economic time series with time-varying volatility (ARCH)". Clive W.J. Granger received his half "for methods of analyzing economic time series with common trends (cointegration)".
In plain words, Engle found a way to measure and forecast how much a financial variable's riskiness changes from calm periods to turbulent periods, rather than assuming risk stays constant.
Granger found a way to spot genuine long-term relationships between economic variables that individually wander without settling down, so that researchers do not mistake coincidence for a real connection.
The prize's full official name is the Sveriges Riksbank Prize in Economic Sciences in Memory of Alfred Nobel, though it is widely called the Nobel Prize in Economics.
It was announced on 8 October 2003 by the Royal Swedish Academy of Sciences, and the total prize amount of 10,000,000 Swedish kronor was divided equally between the two laureates.
Who are the laureates?
Robert F. Engle III
Robert F. Engle III was born on 10 November 1942 in Syracuse, NY, USA. At the time of the award he was affiliated with New York University, New York, NY, USA, where he held the position of Michael Armellino Professor of Management of Financial Services. He received one half of the prize.
Engle initially studied physics at Cornell University for his graduate work but switched to economics, earning his Ph.D. from Cornell University in 1969.
He had earlier taught at the University of California, from which he retired in 2003 before moving to New York University.
His contribution was the development of the ARCH method, a statistical model that captures how the volatility, meaning the size of random swings, in a financial time series changes over time instead of staying fixed.
Clive W.J. Granger
Clive W.J. Granger was born on 4 September 1934 in Swansea, United Kingdom, and died on 27 May 2009 in San Diego, CA, USA.
At the time of the award he was affiliated with the University of California, San Diego, CA, USA, as an emeritus Professor of Economics. He also received one half of the prize.
Granger earned his Ph.D. from the University of Nottingham in 1959. He became a professor at the University of California in 1974.
His major contribution was the concept of cointegration, a method for finding real, stable long-run relationships hidden inside economic variables that individually drift without settling at a fixed value.
What problem were these economists trying to solve?
Economists constantly use time series, chronological records of a variable such as GDP, prices, interest rates or stock prices, to test theories and make forecasts. Building reliable statistical models from this data needs methods that match the data's real behaviour.
By the 1980s two widespread features of economic time series were causing serious trouble for standard statistical tools.
The first problem was nonstationarity. Most macroeconomic series, such as GDP, do not fluctuate around a fixed value; instead a temporary shock can permanently shift their level, so they wander along a stochastic trend.
Standard statistical methods, built for series that do return to a constant value (called stationary series), gave wrong answers when wrongly applied to such wandering series.
Researchers sometimes found what looked like strong statistical relationships between two variables that were, in truth, entirely unrelated.
The second problem was time-varying volatility. On financial markets, the size of random price swings is not constant: calm periods with small fluctuations are followed by turbulent periods with large ones.
Yet until the early 1980s, researchers and market analysts commonly used models that presupposed a constant level of risk, in want of a better alternative, which left them unable to properly forecast or price risk during turbulent episodes.
Both laureates tackled these problems during the 1980s, working independently at first and later collaborating on a jointly authored, highly influential paper.
How does Granger's cointegration work?
Granger's breakthrough addressed the danger of "spurious regressions". In 1974, with his colleague Paul Newbold, Granger showed that applying ordinary regression methods to two completely unrelated nonstationary series could still produce results that looked like a statistically significant relationship.
This meant many existing macroeconomic models built on such series could have been reporting nonsensical connections.
A simple fix tried by some statisticians was to work with differences (growth rates) instead of levels, because differenced series are often stationary.
But economic theory is usually written in terms of levels, such as the level of consumption or income, not growth rates, so this fix threw away useful long-run information.
Granger's actual solution was his discovery that, although two or more nonstationary series individually wander, a specific combination of them may be stationary, meaning it does settle down and fluctuate around a fixed value. He called this phenomenon cointegration.
Where an economic theory predicts a long-run equilibrium relationship (for example, between exchange rates and relative price levels), the variables may drift apart in the short run but a particular combination of them will not drift permanently.
The logical steps behind testing and using cointegration run as follows:
- Check whether each individual time series is nonstationary, meaning it does not return to a fixed value.
- Test whether a specific linear combination of the nonstationary series is itself stationary.
- If such a stationary combination exists, treat the series as cointegrated and identify the combination as the long-run equilibrium relationship.
- Build an error-correction model that expresses short-run changes in each variable as partly driven by how far the system currently is from that long-run equilibrium.
- Use the error-correction model to separate short-run fluctuations from the gradual adjustment back towards the long-run relationship.
Granger and Engle together developed the statistical techniques, published in 1987, for testing whether cointegration exists and for estimating the resulting models; later refinements came from other researchers including Søren Johansen.
Diagram
a nonstationary pair that moves together
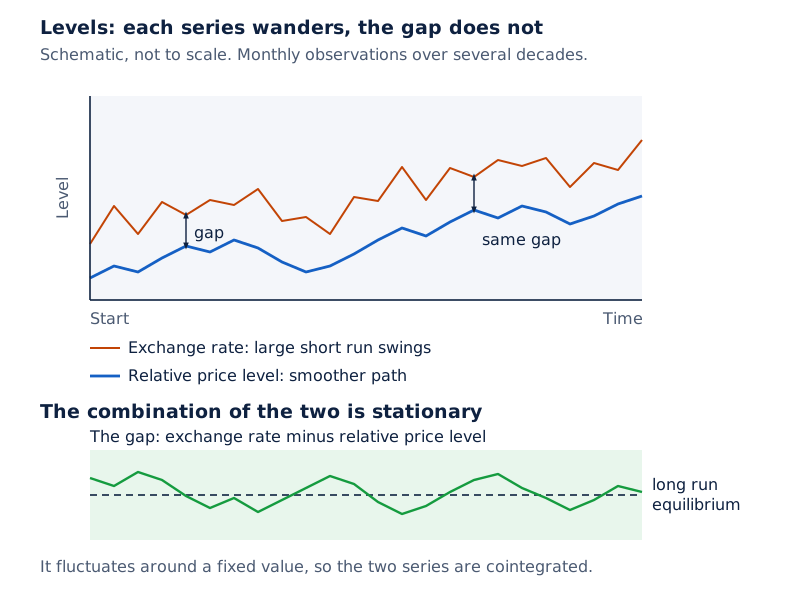
Draw two wandering lines on the same time axis, one representing an exchange rate and one representing a relative price level, each drifting up and down over decades without returning to a fixed level, but with the gap between them staying roughly steady, showing a cointegrating relationship.
Drawn by One Young India.
How does Engle's ARCH method work?
Engle's problem was different: it concerned how to forecast risk, not how to find long-run relationships. Investors and banks need to know how much a stock price or portfolio might move tomorrow, not just on average over history.
Before Engle's work, statistical models generally assumed the variance of the random error term in a forecasting equation, which represents the part of the movement that cannot be explained, stayed constant over time.
Engle instead assumed that this variance in a given period depends systematically on the size of previous errors, so that a large swing tends to be followed by another large swing (of either sign), and a small swing by another small one. He called this property autoregressive conditional heteroskedasticity, shortened to ARCH.
The procedure for building and using an ARCH-type model can be summarised as:
- Write a standard forecasting equation for the variable of interest (for example, a stock return), leaving a random error term.
- Instead of assuming the error's variance is constant, model it as depending on the size of the error in earlier periods.
- Estimate the parameters of this conditional-variance equation together with the forecasting equation, using maximum likelihood methods.
- Test whether the conditional variance is genuinely time-varying, using a statistical test for the presence of ARCH effects.
- Use the fitted model to forecast tomorrow's volatility, not just tomorrow's expected return.
Engle's student Tim Bollerslev extended the idea in 1986 into the generalized ARCH model, known as GARCH, which also lets the variance depend on its own past values, not only on past errors; GARCH became the most widely used version in practice.
Diagram
calm and turbulent volatility
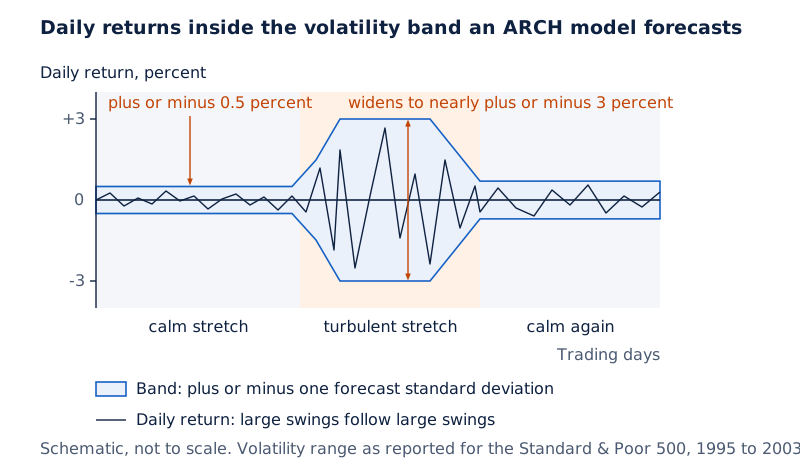
Draw a line of daily stock returns fluctuating near zero, with a band around it that narrows during calm stretches and widens sharply during turbulent stretches, illustrating time-varying volatility that an ARCH model is built to capture.
Drawn by One Young India.
The Royal Swedish Academy of Sciences said in its press release that Engle's ARCH models "have become indispensable tools not only for researchers, but also for analysts on financial markets, who use them in asset pricing and in evaluating portfolio risk".
What examples show cointegration and ARCH in use?
The popular information page gives concrete illustrations from real data. For cointegration, it points to the relationship between the Japanese yen to US dollar exchange rate and the ratio of Japanese to US consumer prices between 1970 and 2003: the exchange rate swung widely in the short run, but over the long run it tended to track the relative price levels, consistent with the economic idea of purchasing power parity.
Other areas listed where cointegration analysis has proved useful include the relationship between wealth and consumption, between dividends and stock prices, and between interest rates of different maturities, in each case because short-run dynamics are affected by large random disturbances while long-run dynamics are constrained by an economic equilibrium relationship.
For ARCH, the popular information page uses the Standard & Poor 500 stock index between May 1995 and April 2003, where returns averaged about 5.3 percent a year but the standard deviation of daily returns, measured over rolling four-week windows, ranged from roughly 0.5 percent in calm periods to nearly 3 percent in turbulent periods.
A worked illustration in the source shows how this fed into practical risk calculations.
Worked example 1. If a GARCH-type model forecasts a standard deviation of daily returns of 0.5 percent for an investor holding a Standard & Poor 500-like portfolio, what is the 99 percent loss estimate for the next day, compared with a forecast of 3 percent?
Answer: according to the popular information page, a forecasted standard deviation of 0.5 percent corresponds to a 99 percent-probability loss of no more than 1.2 percent of portfolio value, while a forecasted standard deviation of 3 percent corresponds to a potential loss as high as 6.7 percent, showing how far risk estimates change between calm and turbulent periods.
| Concept | What it fixes | Typical real-world use |
|---|---|---|
| Cointegration (Granger) | Spurious relationships between wandering (nonstationary) series | Exchange rates and prices, wealth and consumption, interest rates of different maturities |
| ARCH/GARCH (Engle) | Wrongly assuming risk (volatility) is constant over time | Forecasting stock-market risk, pricing options, bank value-at-risk models |
How did the discovery unfold?
Both halves of the 2003 prize grew out of research carried out mainly during the 1980s, though each laureate's path started earlier and the two later came together in one joint paper.
Granger's route began with a warning: in 1974 he and Paul Newbold showed that fitting regressions to unrelated wandering series could produce results that looked statistically meaningful purely by chance, a trap known as spurious regression. This pushed Granger to search for a sounder way of handling such series.
In 1981 he set out the idea of a variable's "order of integration", a way of describing how many times a series must be differenced before it settles down, which laid the groundwork for defining cointegration. In 1983, working with Weiss, he formalised the link between cointegrated systems and error-correction models in what became known as the Granger representation theorem.
Engle's path moved on a separate track. In 1982 he published the original ARCH paper, introducing a model in which a variable's conditional variance depends on the size of earlier errors rather than staying fixed; his first application was to inflation data. In 1986 his student Tim Bollerslev extended this into the generalized ARCH (GARCH) model, now the version most widely used in practice.
The two strands met in 1987, when Engle and Granger co-authored an influential paper that gave rigorous statistical tests for cointegration and a practical two-step method for estimating cointegrated systems, a method later improved upon by Søren Johansen.
The table below sets out this sequence year by year.
| Year | Event |
|---|---|
| 1974 | Clive Granger and Paul Newbold showed that regressions between unrelated nonstationary series could produce misleading, apparently significant results ("spurious regressions"). |
| 1981 | Granger introduced the concept of degree of integration, the idea later developed into cointegration, describing how strongly a variable needs differencing to become stationary. |
| 1982 | Robert Engle published his original article formulating the ARCH model for time-varying volatility, first applied to inflation. |
| 1983 | Granger, with Weiss, formalised the link between cointegrated variables and error-correction models, the result later known as the Granger representation theorem. |
| 1986 | Tim Bollerslev, Engle's student, developed the generalized ARCH (GARCH) model, now the most widely used version. |
| 1987 | Engle and Granger published their jointly authored paper giving rigorous statistical tests and estimation methods for cointegrated systems. |
| 2003 | The Royal Swedish Academy of Sciences announced the prize for Engle and Granger on 8 October, divided equally between them. |
Why does it matter?
Granger's cointegration method, according to the Nobel Prize's popular information page, "transformed the way economists deal with time-series data"; testing for stationarity and cointegration became a routine step before building dynamic economic models.
It gave researchers a disciplined way to separate short-run noise from genuine long-run economic relationships, useful for policy analysis, central-bank modelling and forecasting.
Engle's ARCH framework opened an entirely new research area that the presentation speech called financial econometrics.
The presentation speech noted this was "a striking example of basic research... which engendered unexpected applications in wholly new areas", since the original 1982 application was to inflation, a macroeconomic variable, before its main use turned out to be in financial markets.
ARCH-type models became central to pricing financial instruments and assessing bank risk; the source notes that since 1996, an international agreement known as the Basle rules has required the use of value-at-risk calculations, of the kind ARCH models support, in setting banks' capital requirements. Both methods remain standard tools in applied economics and finance.
How does this connect to what you study?
Students who study basic statistics will recognise the idea of a mean and a standard deviation, which measures how spread out a set of values is around its average.
ARCH and GARCH models are, at heart, a way of letting the standard deviation of a variable's random movements change from one time period to the next instead of assuming it stays fixed, an extension of the same idea taught at school level.
Similarly, cointegration builds on the basic idea of a regression line, fitting a straight-line relationship between two variables.
Granger's insight was about when such a fitted relationship can be trusted and when it can be misleading, a caution worth remembering whenever two trending quantities, such as population and any other growing variable, are compared over time.
Quick facts for exams
The Sveriges Riksbank Prize in Economic Sciences in Memory of Alfred Nobel 2003, commonly called the Nobel Prize in Economics, was announced on 8 October 2003 by the Royal Swedish Academy of Sciences. It was shared equally between Robert F.
Engle III of New York University, cited for methods analysing time series with time-varying volatility known as ARCH, and Clive W.J.
Granger of the University of California, San Diego, cited for methods analysing time series with common trends known as cointegration.
Both methods, developed mainly in the 1980s, solved separate statistical problems that had made standard regression tools unreliable for much real economic data, and both are still widely used by economists, statisticians and financial-market analysts today.
| Fact | Detail |
|---|---|
| Prize | Sveriges Riksbank Prize in Economic Sciences in Memory of Alfred Nobel 2003 |
| Date announced | 8 October 2003 |
| Laureates | Robert F. Engle III and Clive W.J. Granger |
| Country of birth | Engle: USA; Granger: United Kingdom |
| Affiliation at award | Engle: New York University, USA; Granger: University of California, San Diego, USA |
| Shares | One half each |
| Citation (Engle) | "for methods of analyzing economic time series with time-varying volatility (ARCH)" |
| Citation (Granger) | "for methods of analyzing economic time series with common trends (cointegration)" |
| Prize amount | 10,000,000 Swedish kronor |
Note: Source. The prize facts in this note are from the Nobel Prize's official site, nobelprize.org.
Glossary
- Time series — a sequence of measurements of a variable recorded at successive points in time, such as monthly GDP or daily stock prices.
- Stationary series — a time series that fluctuates around a fixed value or a given trend rather than drifting away permanently.
- Nonstationary series — a time series, such as GDP, that follows a stochastic trend so a temporary disturbance can have a long-lasting effect on its level.
- Stochastic trend — a trend in a series whose path is partly random, so past shocks keep shifting the series rather than fading away.
- Cointegration — a situation where a specific combination of two or more nonstationary series is itself stationary, revealing a genuine long-run relationship.
- Spurious regression — a statistical result that wrongly suggests a significant relationship between variables that are in fact unrelated.
- Error-correction model — a model expressing short-run changes in variables as partly driven by the gap from their long-run equilibrium relationship.
- Volatility — the degree of fluctuation in a financial variable's returns over time, used as a measure of risk.
- ARCH — autoregressive conditional heteroskedasticity, a model where a variable's conditional variance depends on the size of its own past errors.
- GARCH — generalized ARCH, an extension where conditional variance also depends on its own past values, developed by Tim Bollerslev.
- Standard deviation — the square root of the variance, giving a typical size of deviation from the mean value of a series.
- Value at risk — an estimate of the maximum likely loss on a portfolio over a given period at a chosen probability level, used by banks for risk control.
- Purchasing power parity — the theory that exchange rates adjust so that a bundle of goods costs the same across countries when expressed in a common currency.
Common errors and misconceptions
- Misconception: ARCH and GARCH are the same model. Correct: ARCH, introduced by Engle in 1982, lets conditional variance depend on past errors only; GARCH, developed by Tim Bollerslev in 1986, extends this by also letting variance depend on its own past values.
- Misconception: cointegration means two series always move in exactly the same direction. Correct: cointegrated series can drift apart substantially in the short run; cointegration only requires a specific combination of them to be stationary in the long run.
- Misconception: a nonstationary series is simply one with a rising trend. Correct: nonstationarity means the series has no tendency to return to a constant value or fixed trend because shocks permanently shift its level, which is a broader idea than just trending upward.
- Misconception: Granger and Engle worked entirely separately throughout their careers. Correct: although their main ideas (cointegration and ARCH) were developed independently, they jointly authored an influential 1987 paper giving the statistical tests and estimation methods for cointegrated systems.
- Misconception: volatility models are only useful for predicting average stock returns. Correct: ARCH-type models forecast the size of fluctuations (risk), not the average return itself, which is a separate quantity.
- Misconception: the Nobel Prize in Economics is awarded directly by the Nobel Foundation like the original Nobel prizes. Correct: it is formally the Sveriges Riksbank Prize in Economic Sciences in Memory of Alfred Nobel, decided by the Royal Swedish Academy of Sciences.
Exam-style questions with model answers
Q1. What was Robert Engle's citation for the 2003 prize? [2 marks]
- Robert Engle was cited "for methods of analyzing economic time series with time-varying volatility (ARCH)", recognising his development of statistical models that let risk change over time rather than stay constant.
Q2. Name the two laureates of the Nobel Prize in Economics 2003 and their affiliations at the time of the award. [2 marks]
- Robert F. Engle III was at New York University, USA, and Clive W.J. Granger was at the University of California, San Diego, USA, each receiving one half of the prize.
Q3. Explain, in your own words, what is meant by a nonstationary time series and why it causes problems for ordinary regression. [4 marks]
- A nonstationary time series, such as GDP or a stock price index, does not fluctuate around a fixed value or a steady trend; instead a temporary shock can shift its level permanently, so the series wanders along what economists call a stochastic trend.
- When two such wandering series are compared using ordinary regression methods built for stationary data, the results can be misleading. Granger and Paul Newbold showed in 1974 that regressing two entirely unrelated nonstationary series on each other could still produce a result that looked like a statistically significant relationship, a problem known as spurious regression.
- This matters because much macroeconomic data, including GDP, consumption and asset prices, is nonstationary, so applying naive statistical methods to it risked producing nonsensical conclusions about real economic relationships.
Q4. Describe how Engle's ARCH approach differs from the statistical practice that came before it. [4 marks]
- Before Engle's 1982 work, researchers and financial analysts typically modelled the random error in a forecasting equation as having a constant variance over time, even though it was clear that financial returns go through calmer and more turbulent periods.
- Engle instead assumed that the conditional variance of the error in a given period depends systematically on the size of errors in earlier periods, so a large swing tends to be followed by another large swing and a small swing by another small one.
- This is called autoregressive conditional heteroskedasticity, or ARCH, and it allowed the variance itself to be estimated and forecast jointly with the main forecasting equation, rather than being assumed fixed.
- The approach made forward-looking volatility forecasts possible for the first time, which became essential for pricing financial instruments and managing portfolio risk.
Q5. Discuss how Granger's concept of cointegration changed the way economists build models with macroeconomic time series, giving at least two areas of application. [5 marks]
- Before Granger's work, model builders faced a dilemma with nonstationary variables: using them in levels risked spurious regressions, while using only their differences (growth rates) discarded the long-run information that economic theory, which is usually formulated in terms of levels, actually needed.
- Granger's key discovery was that a specific combination of two or more nonstationary series can itself be stationary. He named this property cointegration, and it meant that even though individual variables wander, a particular combination of them represents a genuine, statistically valid long-run equilibrium relationship.
- He showed that cointegrated systems could be expressed as an error-correction model, which separates short-run fluctuations from the gradual adjustment of variables back towards their long-run equilibrium, giving both statistically sound and economically meaningful results.
- Granger and Engle jointly developed the formal statistical tests and two-step estimation method for cointegrated systems in their influential 1987 paper.
- Applications named in the source include the relationship between exchange rates and relative price levels (purchasing power parity), the relationship between wealth and consumption, and the relationship between interest rates of different maturities, in each case because short-run dynamics are driven by random disturbances while long-run dynamics are tied down by an economic equilibrium condition.
Q6. Why did the Royal Swedish Academy of Sciences describe Engle's work as leading to "unexpected applications"? [3 marks]
- Engle's original 1982 ARCH paper applied the model to a macroeconomic series, inflation, as its test case.
- However, it soon became clear that the method's most significant uses would be in financial markets rather than macroeconomics, for tasks such as asset pricing and evaluating portfolio risk.
- The presentation speech called this a striking example of basic research, driven by curiosity, generating unexpected applications in a wholly new area, namely the field now known as financial econometrics.
Q7. State the full official name of the prize awarded to Engle and Granger in 2003. [1 mark]
- The Sveriges Riksbank Prize in Economic Sciences in Memory of Alfred Nobel.
Q8. What did Tim Bollerslev contribute in 1986, and why was it useful? [3 marks]
- Tim Bollerslev, who was Robert Engle's graduate student, developed the generalized ARCH model, known as GARCH, in 1986.
- GARCH let the conditional variance in a given period depend not only on past errors, as in the original ARCH model, but also on the variance itself in earlier periods.
- This made the model more useful in practice because it could capture persistent volatility patterns with far fewer parameters, and GARCH has since become the most commonly applied volatility model.
Key takeaways
- The Nobel Prize in Economics 2003 went jointly to Robert F. Engle III and Clive W.J. Granger for separate methods of analysing economic time series.
- Engle's ARCH method models how financial volatility changes over time instead of assuming it stays constant.
- Granger's cointegration concept identifies genuine long-run relationships hidden inside wandering, nonstationary economic variables.
- Both laureates' key ideas were developed mainly during the 1980s and jointly refined in a 1987 paper.
- ARCH and GARCH models underpin modern risk assessment, asset pricing and bank value-at-risk calculations.
- Cointegration analysis is now a routine step before building dynamic macroeconomic and financial models.
- The prize amount of 10,000,000 Swedish kronor was shared equally between the two laureates.
- The prize illustrates how basic statistical research can unexpectedly transform an entirely different applied field, here financial markets.
Test yourself
What does ARCH stand for?
ARCH stands for autoregressive conditional heteroskedasticity, a model where the variance of a random error depends on past errors.
Who developed the generalized ARCH (GARCH) model and when?
Tim Bollerslev, a graduate student of Robert Engle, developed the generalized ARCH model in 1986.
What phenomenon did Granger and Paul Newbold describe in 1974?
They described spurious regressions, where unrelated nonstationary time series could appear statistically related purely by chance.
At which university was Clive Granger affiliated when he won the prize?
Clive Granger was an emeritus Professor of Economics at the University of California, San Diego, in the United States.
What real-world example does the source give for cointegration between exchange rates and prices?
The source uses the Japanese yen to US dollar exchange rate compared with relative Japanese and US consumer price levels from 1970 to 2003.
How much was the Sveriges Riksbank Prize worth in 2003?
The total prize amount was 10,000,000 Swedish kronor, shared equally between Robert Engle and Clive Granger.
What is an error-correction model used for?
It separates short-run fluctuations in variables from their gradual adjustment back towards a long-run equilibrium relationship.
Why were constant-variance models unsuitable for financial returns, according to the source?
Because financial volatility actually alternates between turbulent, high-fluctuation periods and calmer, low-fluctuation periods over time.