
The Mathematics of Maybe: Introduction to Probability | CBSE Class 9 Maths Notes
On this page
This note covers probability and randomness, the probability scale, random experiments, sample spaces and events, experimental and theoretical probability, relative frequency, sampling, independent trials, the Gambler’s Fallacy, and the use of tables and tree diagrams to organise possible outcomes.
What do probability and randomness mean?
Probability measures the likelihood that an event will occur. An event is one possible result or a group of possible results of a random action. Probability expresses how confident we are that the event will happen.
Length, area and volume measure physical quantities. Probability measures uncertainty. Questions about rain, a school hockey match or selection in a school assembly lucky draw involve possible results whose actual occurrence is not known beforehand.
What makes an experiment random?
Definition: A random experiment is a repeatable action whose result may differ on different repetitions and cannot be known in advance. A trial is one performance of the experiment, and an outcome is its result.
Randomness means that the exact result cannot be predicted, even when all the possible outcomes are known. A coin can show heads or tails. A standard six-sided die can show 1, 2, 3, 4, 5 or 6 on its upper face.
Knowing these possibilities does not identify the result of the next toss or roll. Similarly, a school lucky draw can give every student an equal chance of selection while leaving the identity of the selected student unpredictable.
How do subjective and objective estimates differ?
Subjective probability depends on a person’s interpretation of evidence. One person may think bright sunshine makes rain unlikely, while another may interpret very hot weather as a sign that rain could occur later.
Rain depends on complex atmospheric factors, including temperature, humidity, wind patterns and pressure. Its exact timing and location cannot be predicted perfectly, although data and patterns can help estimate the likelihood of rain.
An objective estimate uses collected evidence or mathematical reasoning. Repeated experiments and past observations provide data. Alternatively, when outcomes are equally likely, meaning they have the same chance, reasoning about the possible results provides a theoretical probability. Here, theoretical probability means reasoning from counts of equally likely possible outcomes and the outcomes satisfying an event. Both methods replace an unsupported guess with an explained estimate.
How does the probability scale express likelihood?
The probability scale runs from 0 to 1. Write P(E) for the probability of an event called E. Here P means probability, E names the event, and the brackets identify the event whose probability is being measured.
Property: Probability lies from 0 to 1
0 ≤ P(E) ≤ 1. The symbol ≤ means “less than or equal to”. The probabilities of most events fall strictly between the endpoints. A probability of 0.75 means a 75% chance, while 0.5 means a 50% chance. The symbol % means per cent, or per hundred.
Property: An impossible event has probability 0
An impossible event cannot occur in the stated experiment. Getting a number greater than 6 on a standard die numbered 1 to 6 is impossible. None of its possible results meets the condition.
Property: A certain event has probability 1
A certain event must occur in the stated situation. Selecting a red sweet from a bag containing only red sweets is certain. Every possible selection gives the required colour.
A fair coin has no bias towards heads or tails. Its symmetry gives no reason for one side to occur more often than the other.
| Likelihood | Example | Reason |
|---|---|---|
| Impossible | A number greater than 6 on a standard die | The faces are numbered 1 to 6. |
| Less likely | A 3 on a standard die | One face shows 3. |
| Even chance | Heads on a fair coin | Heads and tails are equally likely. |
| More likely | A numbered card from 2 to 10 in a deck of 52 cards | 36 cards have these numbers. |
| Certain | A red sweet from an all-red bag | Every sweet is red. |
Equally likely means having the same chance of occurring. An even chance describes an event that is as likely to happen as not to happen. A larger probability expresses a greater likelihood, without making the event certain unless the probability reaches 1.
What the figure shows
Purple cards on the probability scale
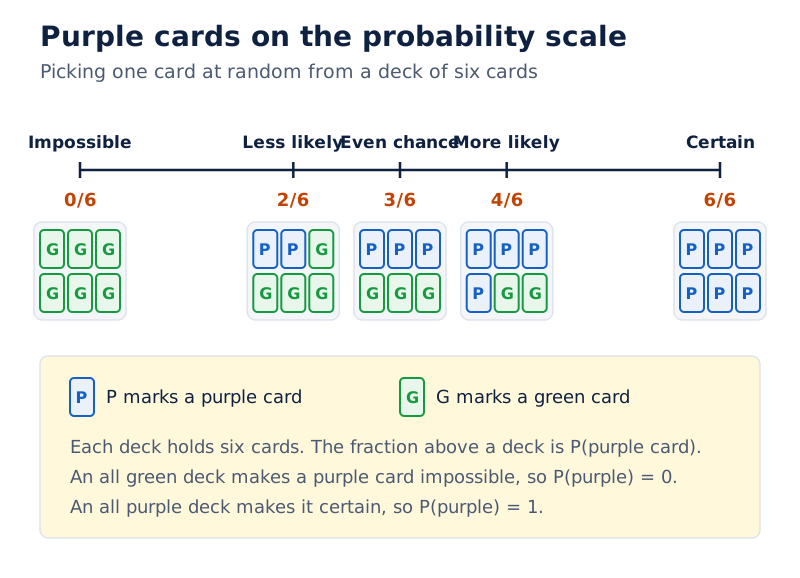
A horizontal line is labelled Impossible, Less likely, Even chance, More likely and Certain. Groups of six green and purple cards below it show increasing numbers of purple cards towards the certain end.
Drawn by One Young India. See Fig. 7.1 in your NCERT textbook
How do we describe a sample space correctly?
Definition: A sample space is the set of all possible outcomes of an experiment. A set is a collection of distinct items; each outcome in this collection is called an element.
The symbol S denotes the sample space. Curly brackets { } enclose its elements, separated by commas. The notation n(S) means the number of elements in S. This count is called the sample size in sample-space notation.
For a coin, use H for heads and T for tails. Then S = {H, T} and n(S) = 2. For a standard die, S = {1, 2, 3, 4, 5, 6} and n(S) = 6.
What checks should a sample space pass?
- Identify exactly what the experiment records.
- Include every possible outcome at that level of detail.
- List no outcome more than once.
- Count the distinct elements to obtain n(S).
For whether it rains tomorrow, S = {Rain, No Rain} is suitable. If the question distinguishes amounts of rainfall, a more detailed list is {No Rain, Drizzle, Light Rain, Heavy Rain}. The required detail depends on the problem being studied.
For a team’s match result, S = {Win, Lose, Draw}. Listing three results identifies what could happen; it does not establish that the three results are equally likely. Listing outcomes and assigning their probabilities are separate tasks.
Why are two-coin outcomes written in order?
When two coins are tossed, the first letter records coin 1 and the second records coin 2. Thus HT means heads on coin 1 and tails on coin 2. TH means tails on coin 1 and heads on coin 2.
| Coin 1 | Coin 2 | Outcome |
|---|---|---|
| H | H | HH |
| H | T | HT |
| T | H | TH |
| T | T | TT |
Consequently, S = {HH, HT, TH, TT} and n(S) = 4. Both HT and TH contain one head and one tail, but they record different results for the individual coins.
How is an event related to the sample space?
An event selects the outcomes that satisfy a particular condition. It is a subset of the sample space, meaning that every outcome belonging to the event also belongs to the sample space.
The letter E can name an event, just as S names the sample space. For a die roll, S = {1, 2, 3, 4, 5, 6}. If E means getting a number greater than 4, then E = {5, 6}.
Favourable outcomes are those that satisfy the event’s condition. “Favourable” describes agreement with that condition; it does not mean that the result is personally desirable. Identify the event before counting its favourable outcomes.
How do event descriptions change the list?
For two coins, the event “at least one head” is E = {HH, HT, TH}. The phrase at least one means one or more, so HH must be included. TT is excluded because it contains no head.
Getting heads twice is a different event: it contains HH alone. Getting one head and one tail contains HT and TH. These different conditions use the same sample space but select different groups of outcomes.
Worked example 1. A fair six-sided die numbered 1 to 6 is rolled. Find the probability of a number greater than 4.
Answer: The sample space is {1, 2, 3, 4, 5, 6}. The favourable outcomes are {5, 6}. There are 2 favourable outcomes among 6 equally likely outcomes, so P(number greater than 4) = 2/6 = 1/3.
What does a sample space of fruit types describe?
A fruit-type sample space may be {Apple, Banana, Orange}. In this example, the event “picking a fruit that is yellow” is {Banana}. The list identifies fruit types, rather than the number of individual fruits of each type.
Do not assume equal probabilities from a list of categories alone. The theoretical counting method needs equally likely outcomes. First check what each listed element represents, then decide whether those elements can be treated as equally likely.
How is experimental probability calculated?
Experimental probability, also called empirical probability, uses actual observations. The frequency of an event is the number of times it occurs. Its relative frequency is that count divided by the total number of trials.
Definition: Experimental probability = number of times the event occurred / total number of trials. The slash / means division. This fraction expresses the proportion, or share of the total, of recorded trials in which the chosen event happened.
How should experimental data be processed?
- Specify the experiment and the event being observed.
- Perform the trials and record the outcome each time.
- Count the trials in which the event occurred.
- Divide that frequency by the total number of trials.
Worked example 2. A die is rolled 50 times and shows a 4 exactly 8 times. Calculate the experimental probability of rolling a 4.
Answer: The event occurs 8 times in 50 trials. Experimental probability = 8/50 = 0.16 = 16%. The frequency is 8, while the relative frequency is 0.16.
The denominator, the number below a fraction bar, counts the recorded trials, not the faces of the die. Dividing the observed frequency 8 by 6 would be incorrect. The theoretical probability uses one favourable face among six equally likely faces, giving 1/6, whereas the experimental probability uses eight occurrences among 50 recorded rolls, giving 8/50.
What can be measured when outcomes are not assumed equally likely?
A paper cup can land on its bottom, upside down on its top, or on its side. Tossing it 100 times and recording its position provides evidence for assigning experimental probabilities to these outcomes.
Three named landing positions do not by themselves establish equal chances. Use their recorded frequencies. Without the actual counts, numerical experimental probabilities for the cup cannot be calculated from the total number of tosses alone.
Similarly, a coin-toss activity asks for 20 tosses with every result recorded. The experimental probability of heads uses the number of heads actually obtained. It should not be replaced by a made-up record or by the theoretical value without examining the data.
How is theoretical probability calculated?
Theoretical probability uses reasoning about possible outcomes in a fair situation. Its counting formula assumes that the outcomes being counted are equally likely. Experimental results are not needed to apply this formula.
Definition: Theoretical probability of an event = number of favourable outcomes / number of possible outcomes, provided all the possible outcomes being counted are equally likely.
A fair or unbiased coin is symmetrical, so there is no reason for it to land more often on one side than the other. A random toss lets it fall freely without bias or interference.
How does counting work for a die?
Worked example 3. Find the theoretical probability of rolling a 4 on a fair six-sided die numbered 1 to 6.
Answer: One outcome, 4, is favourable. There are 6 possible equally likely outcomes. Therefore P(rolling a 4) = 1/6 = 0.1666… ≈ 0.167, or 16.7%. The symbol ≈ means approximately equal to, and … indicates continuing digits.
The theoretical value 1/6 and the experimental value 8/50 describe different calculations. The first uses equally likely faces. The second uses the actual result of 50 trials. The calculation should match the kind of evidence supplied.
How should repeated letters be counted?
Worked example 4. A letter position is selected at random from PROBABILITY, with every position equally likely. Find the probability of selecting B.
Answer: There are 11 letter positions, including 2 occupied by B. Hence P(picking B) = 2/11 = 0.1818… ≈ 0.182, or 18.2%.
The numerator, the number above a fraction bar, counts the favourable positions. Count the letters as they occur in the word. The two Bs occupy different positions and both count towards the event. Counting only distinct letter names would change the experiment and would not give the correct denominator for this selection.
The condition of equal likelihood is essential throughout. A fair coin and a fair standard die justify equal chances for their basic outcomes. A situation with two named alternatives does not automatically give each alternative a probability of one-half.
How can survey data support probability estimates?
Statistical data are collected observations that can support estimates. Such evidence is used in marketing, sales forecasting, insurance, science and social science research. In a survey, relative frequency connects a recorded count with a probability estimate.
A population is the whole group being considered. A sample is the smaller group from which evidence is collected. Sampling is the process of collecting such evidence from a sample to help understand the population.
What does the favourite-fruit survey show?
In a class of 50 students, 20 prefer mango, 15 prefer apples, 10 prefer bananas and 5 prefer grapes. These are the given observations, rather than assumed equal preferences.
| Favourite fruit | Number of students |
|---|---|
| Mango | 20 |
| Apples | 15 |
| Bananas | 10 |
| Grapes | 5 |
Worked example 5. Using the survey of 50 students, of whom 20 prefer mango, estimate the probability that a randomly chosen student from the class prefers mango. If one fruit is to be bought for each of 1500 students in the school, use the sample proportion to estimate how many mangoes to purchase.
Answer: The probability estimate is 20/50 = 0.4, or 40%. Applying this proportion to 1500 students gives approximately 600 mangoes to purchase. The symbol × means multiplication: 0.4 × 1500 = 600.
Why must the school estimate remain an estimate?
Evidence from one class does not amount to asking every student in the school. It is usually impractical to collect data from the entire population. Applying the class proportion to the school therefore produces an approximate purchasing estimate.
For more confidence, a larger sample could include 100 students from different classes or grades. A representative sample reflects the population being studied. Sample size and fair representation can help results be more accurate; neither should be confused with certainty.
The word “sample” needs context. In a survey, its size counts the people or objects observed. In sample-space notation, n(S) counts the possible outcomes of an experiment. These counts answer different questions.
Why can experimental and theoretical probabilities differ?
Experimental probability depends on actual data. Theoretical probability depends on an assumption of equally likely outcomes. Even in perfectly fair situations, the two values can differ, especially when the number of trials is small.
| Feature | Experimental probability | Theoretical probability |
|---|---|---|
| Basis | Recorded trials or observations | Reasoning about equally likely outcomes |
| Numerator, the number above a fraction bar | Times the event occurred | Number of favourable outcomes |
| Denominator, the number below a fraction bar | Total number of trials | Total number of possible outcomes |
| Need for experimental records | Uses actual data | Does not require experimental data |
Worked example 6. A fair six-sided die numbered 1 to 6 is rolled 12 times and shows 3 on three rolls. Compare the experimental and theoretical probabilities of getting 3.
Answer: Experimental probability = 3/12 = 1/4. Theoretical probability = 1/6, because one of the six equally likely faces shows 3. A short record of 12 rolls need not reproduce the theoretical proportion exactly.
What does the Law of Large Numbers mean here?
As the number of trials increases, experimental probability tends to get closer to theoretical probability. This is the Law of Large Numbers. The phrase “tends to” is essential: it does not promise an exact match after a specified number of trials.
Repeating the die experiment 60, 600 or 6000 times gives more observations. The expected tendency is towards the theoretical value in a fair experiment. It is not a rule that each extra roll must make the observed fraction closer.
What is the Gambler’s Fallacy?
Independent trials are trials for which earlier results do not change the chances on the next trial. The Gambler’s Fallacy is the mistaken belief that an outcome becomes due, or cannot recur, because of earlier random results.
After six consecutive heads on a fair coin, the probability of tails on the next toss remains 1/2, or 50%. Similarly, after three consecutive sixes on a fair die, the probability of another six remains 1/6. The coin and die have no memory of earlier results.
How do tree diagrams organise multi-step experiments?
A tree diagram is a branching representation of the possible outcomes of an experiment carried out in stages. Each complete path from the starting point to an endpoint represents one complete outcome.
In the independent examples considered here, such as tossing a fair coin twice, each stage has its own possible results. The branches make the order visible and help prevent missing an outcome when listing the sample space.
How is the two-toss tree constructed?
- Start at a single point representing the beginning of the experiment.
- Draw branches labelled H and T for the first toss.
- From each branch endpoint, draw another H branch and another T branch for the second toss.
- Read the complete paths as HH, HT, TH and TT.
What the figure shows
Two tosses of a fair coin
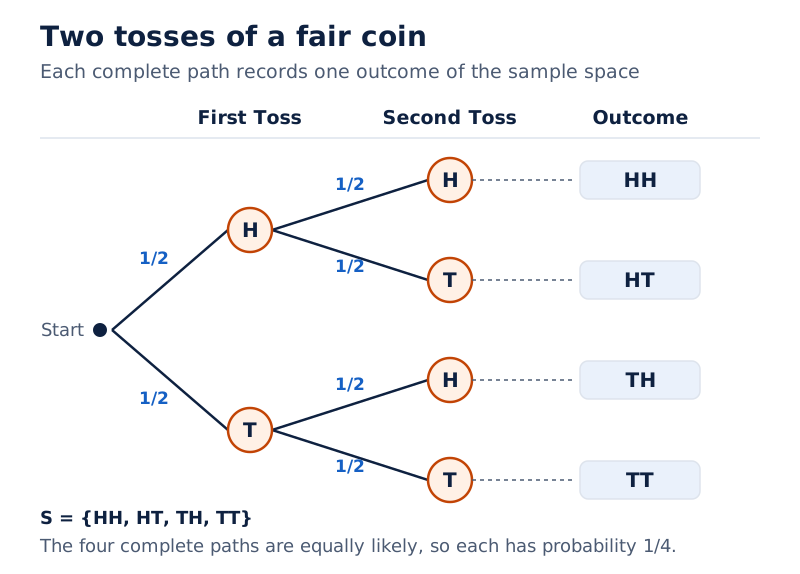
The tree has columns headed First Toss, Second Toss and Outcome. The first pair of branches and each following pair are labelled 1/2. The four completed paths show HH, HT, TH and TT.
Drawn by One Young India. See Fig. 7.6 in your NCERT textbook
The four ordered outcomes are equally likely for the fair independent tosses. A branch records a result at one stage; a complete path records both stages. Distinguishing these prevents counting an unfinished branch as a full outcome.
Worked example 7. A fair coin is tossed twice in independent trials. Find the probability of getting heads twice.
Answer: S = {HH, HT, TH, TT}. Heads twice is represented by HH alone. There is 1 favourable outcome out of 4 equally likely outcomes, so P(HH) = 1/4 = 0.25 = 25%.
How does the same tree answer a different question?
For one head and one tail, both HT and TH satisfy the condition. The probability is therefore 2/4 = 1/2. For at least one head, HH also qualifies, giving 3/4. The tree stays the same, while the selected event changes.
A tree can also organise fruit selections or pen colours across successive choices. Before using simple counts to calculate probabilities, check that the completed outcomes being counted are equally likely. A branching picture alone does not establish this condition.
How can probability calculations be applied to recorded data?
Begin a data problem by identifying the group observed, its total size and the category requested. Then choose the relevant frequency. If the question asks about a larger population, distinguish the observed proportion from the estimated population count.
How are sample proportions extended to a larger group?
Worked example 8. A mixed bag contains 600 sweets. A random sample of 30 contains 10 red, 8 green, 7 yellow and 5 blue sweets. Find the probability of green within the sample and estimate the number of yellow sweets in the whole bag.
Answer: P(green from the sample) = 8/30 = 4/15. The observed yellow proportion is 7/30. The estimated number of yellow sweets in the bag is (7/30) × 600 = 140. This is an estimate based on the sample.
The green probability and the yellow estimate answer different questions. The first describes random selection from the known sample. The second applies a sample proportion to the whole bag, where the complete colour counts have not been observed.
How should a frequency table be read?
A tyre company records the distance before replacement in 1000 cases. The unit km means kilometre. Read each printed distance category together with its count before choosing the numerator.
| Distance (km) | Number of cases |
|---|---|
| Less than 4000 | 20 |
| 4001 to 9000 | 210 |
| 9001 to 14000 | 325 |
| More than 14000 | 445 |
Worked example 9. In the tyre record of 1000 cases, 20 tyres lasted less than 4000 km and 445 lasted more than 14000 km. Find the respective probabilities for a randomly chosen recorded case.
Answer: P(less than 4000 km) = 20/1000 = 0.02. P(more than 14000 km) = 445/1000 = 0.445. Both denominators use all 1000 recorded cases.
State the event in words beside the calculation. This keeps the count attached to its meaning and helps distinguish a category frequency from the total. A correct fraction needs both a suitable numerator and the appropriate denominator.
Glossary
- Probability — A measurement of how likely a specified event is to occur, expressed on a scale from zero to one.
- Random experiment — A repeatable action whose possible results are known but whose actual result cannot be predicted in advance.
- Trial — One performance of an experiment, such as a single toss of a coin or roll of a die.
- Outcome — A possible result of an experiment, such as heads when a coin is tossed.
- Sample space — The set of all possible outcomes of an experiment, with each distinct outcome included once.
- Event — One outcome or a group of outcomes selected from the sample space by a stated condition.
- Equally likely outcomes — Outcomes having the same chance of occurring in the random experiment being considered.
- Favourable outcomes — The possible results that satisfy the particular condition defining the event whose probability is required.
- Relative frequency — The number of times an event occurred divided by the total number of recorded trials.
- Experimental probability — A probability estimate based on the relative frequency of an event in actual observations or trials.
- Theoretical probability — Probability calculated by dividing the number of favourable outcomes by the total number of equally likely outcomes.
- Population — The whole group about which information is sought, such as all students in a school.
- Sample — A smaller group from which evidence is collected to help estimate characteristics of the whole population.
- Independent trials — Trials in which earlier outcomes do not change the probabilities of the outcomes on the next trial.
- Tree diagram — A branching representation in which each complete path records one possible outcome of an experiment with successive stages.
Common errors and misconceptions
- Misconception: Randomness means that no possible result is known. Correct: All possible results may be known even though the particular result of a single trial is unpredictable.
- Misconception: Every list of two outcomes gives each a probability of 1/2. Correct: Equal likelihood must be justified; listing possibilities alone does not establish their chances.
- Misconception: The experimental probability of a die result has denominator 6. Correct: Its denominator is the number of recorded rolls; six is the count of possible faces.
- Misconception: Repeated letters count just once when choosing a letter position. Correct: Both Bs in PROBABILITY count, because selection is from all 11 letter positions.
- Misconception: HT and TH are the same ordered outcome. Correct: The letters record different coins or successive tosses, so both outcomes belong in the sample space.
- Misconception: “At least one head” excludes HH. Correct: It includes HH, HT and TH, because “at least one” means one or more heads.
- Misconception: A run of heads makes tails due next. Correct: Independent fair tosses retain a 1/2 probability of tails, irrespective of earlier results.
- Misconception: More trials guarantee an exact theoretical proportion. Correct: Experimental probability tends to get closer to theoretical probability; a particular finite record need not match it exactly.
Exam-style questions with model answers
Q1. What is a random experiment? Give the sample space for one toss of a fair coin. [2 marks]
- A random experiment is repeatable, but its actual result cannot be known in advance even when the possible outcomes are known.
- For one coin toss, the sample space is {H, T}, where H means heads and T means tails.
Q2. A fair six-sided die numbered 1 to 6 is rolled 50 times. A 4 appears exactly 8 times. Find the experimental and theoretical probabilities of rolling 4, and explain why they may differ. [3 marks]
- The experimental probability is the observed count divided by the number of trials: 8/50 = 0.16, or 16%.
- The theoretical probability is 1/6, because exactly one of the six equally likely faces has the number 4.
- The experimental value uses a particular record of 50 rolls. Actual observations can differ from the theoretical proportion, even when the die is fair.
Q3. One letter position in PROBABILITY is selected at random, with every position equally likely. Count the total and favourable positions, then calculate the probability of selecting B. [3 marks]
- The word has 11 letter positions. These individual positions are the possible equally likely choices, so the denominator is 11.
- Two positions contain B. Both are favourable, even though they display the same letter, so the numerator is 2.
- The probability of selecting B is therefore 2/11, approximately 0.182, or 18.2%. The calculation counts occurrences rather than distinct letter names.
Q4. A bag contains 600 sweets. A random sample of 30 contains 10 red, 8 green, 7 yellow and 5 blue sweets. Find the green probability within the sample, the yellow proportion, and the estimated yellow count in the bag. Explain the status of the estimate. [4 marks]
- The probability of picking green from the sample is 8/30 = 4/15, using the eight green sweets among all 30 sampled sweets.
- The observed proportion of yellow sweets is 7/30, because seven of the sampled sweets are yellow.
- Applying that proportion to the whole bag gives (7/30) × 600 = 140 yellow sweets as the estimated count.
- This is an estimate based on the sample. It is not a direct count of every yellow sweet in the complete bag.
Q5. A fair coin is tossed twice in independent trials. Describe its tree diagram, list the sample space, and find the probabilities of two heads and of at least one head. Explain how HT and TH differ, using H for heads and T for tails. [5 marks]
- Draw two branches, H and T, from the starting point for the first toss. From each endpoint draw another pair, H and T, for the second toss.
- The complete paths give the sample space {HH, HT, TH, TT}. The four ordered outcomes are equally likely for these independent fair tosses.
- HT means heads first and tails second. TH means tails first and heads second. They are distinct ordered outcomes, so both must be retained.
- Two heads occurs only for HH. Its probability is therefore 1/4, or 0.25.
- At least one head includes HH, HT and TH. There are three favourable outcomes, giving a probability of 3/4.
Q6. In a survey of 50 students, 20 prefer mango, 15 apples, 10 bananas and 5 grapes. The school has 1500 students. Identify the sample and population, find the mango probability within the sample, estimate mangoes to purchase using that proportion, and suggest how to improve confidence in the estimate. [5 marks]
- The sample consists of the 50 students surveyed. Their responses provide the evidence used for the calculation of the observed favourite-fruit proportions.
- The population consists of all 1500 students in the school, the larger group for which the purchase estimate is being made.
- For a randomly selected student in the sample, the probability of preferring mango is 20/50 = 0.4, or 40%.
- Applying this proportion gives 0.4 × 1500 = 600. Approximately 600 mangoes would be purchased using the sample-based estimate.
- A larger, more representative sample could include 100 students from different classes or grades. This would support greater confidence without turning the estimate into certainty.
Q7. A fair coin gives heads six times consecutively. A student says tails must occur next and that enough further tosses must give an exact half of heads. Explain both errors, state the next-toss probability of tails, and give the correct long-run tendency. [4 marks]
- The claim that tails is due is the Gambler’s Fallacy. Earlier heads do not force the opposite result on the next toss.
- The tosses are independent, so the probability of tails on the next toss remains 1/2, or 50%.
- A finite sequence of tosses is not guaranteed to contain exactly half heads, even when the coin is fair.
- As the number of trials increases, the experimental probability tends to get closer to the theoretical probability. This tendency is the Law of Large Numbers.
Key takeaways
- Probability measures likelihood from zero to one, with impossible and certain events at the two endpoints.
- Randomness allows known possible outcomes while leaving the actual result of a particular trial unpredictable.
- A sample space includes every possible outcome once; an event selects the outcomes satisfying a stated condition.
- Experimental probability divides the observed frequency by the number of trials, using actual recorded evidence.
- Theoretical probability divides favourable outcomes by total possible outcomes, provided those outcomes are equally likely.
- Sample-based estimates for a population remain estimates; larger and more representative samples can help improve confidence.
- Experimental probability tends to get closer to theoretical probability as trials increase, without guaranteeing exact agreement.
- Tree diagrams organise successive outcomes, while independence explains why past coin tosses do not change the next toss’s probabilities.
Test yourself
What is the probability of a number greater than 6 on a standard die numbered 1 to 6?
It is 0, because no possible face satisfies the stated condition.
What does n(S) mean when S is a sample space?
It is the number of distinct possible outcomes in the sample space.
Why does a list {Rain, No Rain} not prove equal chances?
The list records possibilities. Equal likelihood needs justification beyond the number of listed outcomes.
A die shows 3 on three of 12 rolls. What is the experimental probability of 3?
It is 3/12 = 1/4, using the recorded frequency and total number of trials.
What outcomes give one head and one tail in two coin tosses, with H meaning heads and T meaning tails?
HT and TH both qualify, because either toss can be the one showing heads.
A fair coin has shown heads six times consecutively. What is the chance of tails next?
The chance remains 1/2, because the independent coin toss has no memory of earlier outcomes.
In a sample of 50 students, 20 prefer mango. What is the probability for a randomly selected sample member?
The probability is 20/50 = 0.4, or 40%, using the given sample’s observed preferences.
What does a complete path in a tree for two coin tosses represent?
It represents one ordered outcome recording the results of both the first and second tosses.
Write about it
Turn a question from this chapter into a paper.
The Writing Studio has a structure guide, a rubric and citation tools for 15 formats, from essays to research papers. Drafting is free with an account. Learnacy Essential adds feedback from an AI writing coach and submission to The OYI Review.
Learnacy Essential is ₹1,499 for the year. Publication depends on review and is not guaranteed.