
Employment: Growth, Informalisation and Other Issues | CBSE Class 12 Economics Notes
On this page
Try an idea before you read. Test your understanding of India's employment structure with this 2-step scenario. Explore →
This note covers workers and economic activities, worker-population ratios, self-employment and hired work, sectoral employment, jobless growth, casualisation, formal and informal employment, unemployment, the Ahmedabad textile-mill case, government employment generation and changes in the workplace.
What is work, and who counts as a worker?
Work provides a livelihood, a sense of self-worth and a way of contributing to society. People also work to meet the needs of their dependants. Studying employment helps explain the use of human resources, employment quality and problems such as exploitation and child labour.
Economic activity and production
Gross domestic product (GDP) is the total money value of final goods and services produced within a country in a year. Final goods and services are intended for final use rather than further processing or resale. Gross national product (GNP) includes the net earning from foreign transactions in the annual product.
Definition: Economic activities contribute to gross national product. A worker is a person engaged in these activities in any capacity, including someone helping the main worker or operating their own enterprise.
A farmer producing grain, a textile worker turning cotton into cloth and a lorry worker transporting goods participate in production. Payment by an employer is not the condition that defines every worker. People working for themselves also belong to the workforce, meaning the people engaged in economic activities.
Workers temporarily absent because of illness, injury, physical disability, bad weather, festivals or social and religious functions are still workers. Employment may last throughout the year or only a few months, and many workers do not receive fair wages.
Work inside the home
Home-based production includes weaving, lace making, handicrafts and programming in the information technology industry. During the Covid-19 pandemic in 2020-21, millions of workers delivered products and services through work-from-home. Mahatma Gandhi stressed education and training through different forms of work, including craft. His objection concerned the craze for labour-saving machinery that left people without work, not machinery itself.
What the figure shows
Home-based football production
The photograph shows people seated together working on footballs. Its caption identifies houses in Jalandhar, Punjab, as places where footballs sold by multinational companies are made.
See Fig. 6.1 in your NCERT textbook
In the exercise cases, Raj works on his farm outside school hours, while Meena helps in the cloth shop owned and operated by her husband. Both participate in economic activities. Their student or homemaker roles do not cancel that productive work.
What does the worker-population ratio measure?
Population means all people residing in a locality at a particular time. The worker-population ratio expresses workers as a percentage of that population. It measures the extent of participation in producing goods and services, rather than describing workers' wages or conditions.
Worker population ratio = (Number of workers ÷ Total population) × 100
The sign ÷ means division, × means multiplication, and % means per cent, or per hundred. Workers and population must be expressed in the same numerical unit. A higher ratio indicates greater engagement in economic activity.
Participation in 2023-24
| Group | Total ratio (%) | Rural ratio (%) | Urban ratio (%) |
|---|---|---|---|
| Men | 56.4 | 56.3 | 56.4 |
| Women | 30.7 | 34.8 | 20.7 |
| All persons | 43.7 | 45.6 | 38.9 |
Rural people have limited resources for earning higher incomes, so more enter the employment market. Many do not attend educational or training institutions, or leave them midway. Their economic circumstances may prevent them from remaining at home without work.
In urban areas, a considerable section can continue studying. Urban people also have varied employment opportunities and look for jobs matching their qualifications and skills. The participation ratio alone cannot establish whether the available work provides a decent livelihood.
Why is women's work underestimated?
It is common for families in which men earn high incomes to discourage women from taking jobs. Many household activities performed by women are not recognised as productive work. This narrow definition leads to underestimation of women workers.
Cooking, collecting water and fuelwood, and unpaid work around farms illustrate the recognition problem. Economists argue that these women should also be called workers. Recorded participation therefore needs to be read alongside the question of which activities are counted.
Note: The share of women within the workforce differs from the worker-population ratio for women. The first uses all workers as its base; the second uses the female population.
How can population data be used to estimate the workforce?
The worker-population calculation can be reversed. If population and the worker-population ratio are known, multiplying them and dividing by 100 gives the estimated number of workers. A crore means ten million, so a population stated in crores gives a workforce estimate in crores.
Workforce = Population × Worker population ratio ÷ 100
Workforce calculations for 1999-2000
The following calculations use population and participation data for 1999-2000. Keep the year attached to the inputs and results. These figures describe a historical exercise and must not be presented as the workforce in 2023-24.
Worked example 1. Rural population was 71.88 crore and the rural worker-population ratio was 41.9%. Estimate the rural workforce.
Answer: Rural workforce = 71.88 × 41.9 ÷ 100 = 30.11772 crore, or approximately 30.12 crore workers.
Worked example 2. Urban population was 28.52 crore and the urban worker-population ratio was 33.7%. Estimate the urban workforce.
Answer: Urban workforce = 28.52 × 33.7 ÷ 100 = 9.61124 crore, or approximately 9.61 crore workers.
Worked example 3. Total population was 100.40 crore and the total worker-population ratio was 39.5%. Estimate the total workforce.
Answer: Total workforce = 100.40 × 39.5 ÷ 100 = 39.658 crore, or approximately 39.66 crore workers.
The overall estimate above uses the supplied overall ratio. It is not obtained by replacing that ratio with an unweighted average of rural and urban ratios. The separately supplied, rounded ratios do not produce perfectly matching totals.
A reliable calculation sequence
- Identify the geographical group and the year to which the figures belong.
- Write the population and worker-population ratio, keeping the population unit visible.
- Multiply population by the ratio and divide by 100.
- Round the result suitably and state the answer as a number of workers, retaining its unit.
These calculations count engagement in economic activity. They do not distinguish a regular employee from someone employed for only part of the year. That requires a separate examination of employment status, meaning the worker's position in the enterprise.
How do self-employed, casual and regular workers differ?
Employment status reveals one dimension of job quality. It helps explain a worker's attachment to a job and authority over the enterprise or other workers. Three people in construction illustrate the distinction: a cement shop owner, a construction worker and a civil engineer employed by a construction company.
| Status | Meaning | Example | Workforce share, 2023-24 (%) |
|---|---|---|---|
| Self-employed | Own and operate an enterprise to earn a livelihood | Cement shop owner | 58.4 |
| Regular salaried employee | Engaged by another person or enterprise and paid wages regularly | Civil engineer in a construction company | 21.7 |
| Casual wage labourer | Engaged casually and paid for the work done | Construction worker | 19.9, rounded |
Self-employment is the largest category. Pavement vegetable vendors and independent lawyers, doctors and engineers are also workers. Being a worker does not necessarily mean receiving a salary, and self-employment alone does not establish how much someone earns.
How do gender and region affect employment status?
What the figure shows
Distribution of employment by gender
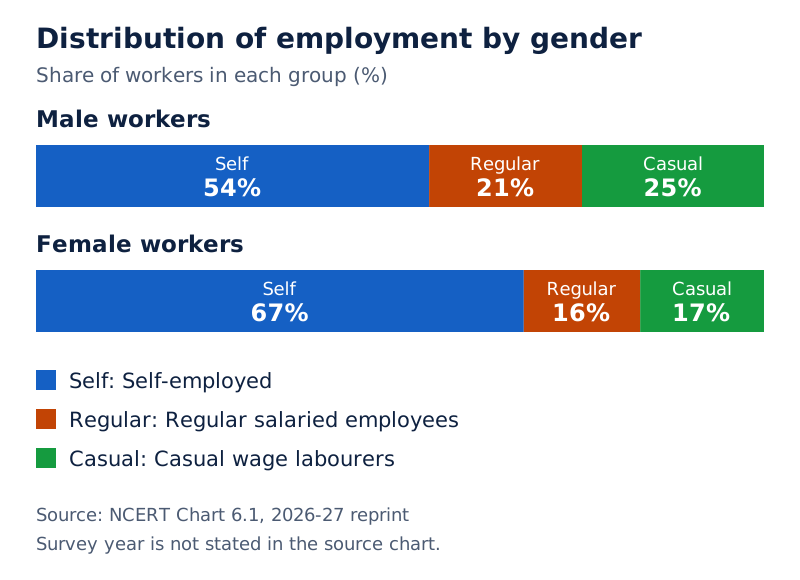
Two pie charts show male workers as 54% self-employed, 21% regular salaried and 25% casual. Female workers are 67% self-employed, 16% regular salaried and 17% casual.
Drawn by One Young India. Reference: NCERT Class 11 Chart 6.1
Self-employment accounts for more than half of both groups. Casual wage work is the second major source for women in this comparison. Men have a greater proportion in regular salaried employment, though the gap is very less.
What the figure shows
Distribution of employment by region
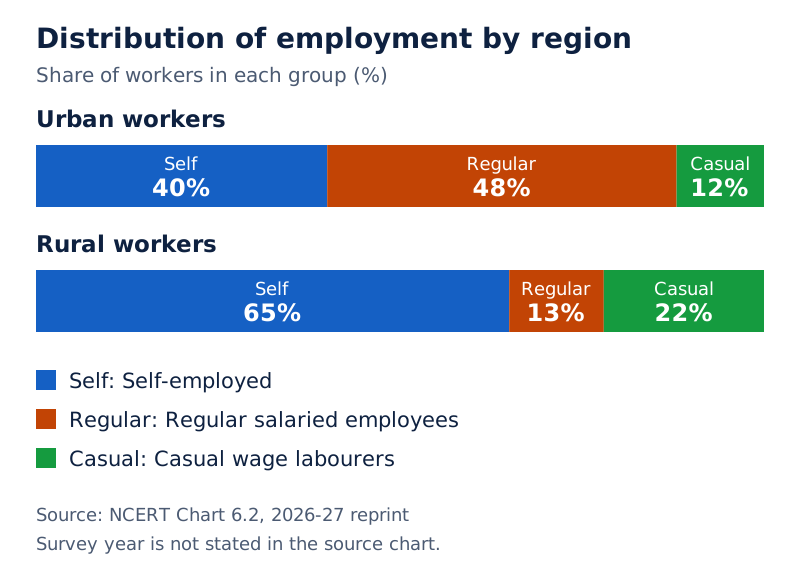
The urban pie chart shows 40% self-employed, 48% regular salaried and 12% casual workers. The rural chart shows 65% self-employed, 13% regular salaried and 22% casual workers.
Drawn by One Young India. Reference: NCERT Class 11 Chart 6.2
Rural self-employment is greater because the majority of people dependent on farming own plots and cultivate independently. Urban enterprises need workers regularly. Everyone cannot independently operate factories, shops or offices, so regular employment has a larger urban share.
Casual wage labourers are the most vulnerable of the three categories. Their classification concerns the nature of engagement, rather than simply whether wages are handed over daily or monthly.
What the figure shows
Brick-making as casual work
The photograph shows workers beside wet material and long rows of bricks laid on the ground. It illustrates brick-making as a form of casual work.
See Fig. 6.2 in your NCERT textbook
How is employment distributed across economic sectors?
Economic activities can be grouped into eight industrial divisions. Combining them into three sectors helps show where people work. The primary sector covers agriculture and mining and quarrying. The secondary sector covers manufacturing, electricity, gas and water supply, and construction.
The tertiary or service sector includes trade, transport and storage, and services. Secondary and service activities are also described as non-farm sectors. Sectoral classification concerns the activity undertaken; employment status concerns the worker's position within that activity.
Distribution of workforce in 2023-24
Each column below divides the workforce of the named group among sectors. These are percentages of workers, not worker-population ratios. Service-sector entries are rounded figures.
| Sector | Rural (%) | Urban (%) | Male (%) | Female (%) | Total (%) |
|---|---|---|---|---|---|
| Primary | 59.8 | 6.7 | 36.3 | 64.4 | 46.1 |
| Secondary | 21.4 | 32.4 | 28.8 | 15.6 | 24.1 |
| Services | 18.8 | 60.9 | 34.9 | 20.0 | 29.8 |
| Total | 100.0 | 100.0 | 100.0 | 100.0 | 100.0 |
The primary sector has the largest overall share. About 60% of rural workers depend on agriculture, forestry and fishing, while about 61% of urban workers are in services. The secondary sector employs about one-third of the urban workforce.
Women's concentration in the primary sector is very high: about 64% of female workers, compared with about 36% of male workers. Men obtain opportunities in both secondary and service activities. These figures describe the distribution within each sex's workforce.
How does development change this distribution?
During economic development, labour moves from agriculture and related activities towards industry and services, with migration from rural to urban areas. At a much later stage, industry's share of total employment begins to decline as services expand rapidly.
What the figure shows
Garment factory employment
The photograph shows women working with garments along long worktables inside a factory. The caption presents garment work as upcoming factory employment for women.
See Fig. 6.3 in your NCERT textbook
What do jobless growth and casualisation mean?
Jobless growth describes an economy producing more goods and services without generating employment. Growth of output and growth of jobs therefore need separate examination. An increase in GDP does not by itself show that employment opportunities have expanded correspondingly.
Output growth compared with employment growth
During 1951-2023, GDP growth was positive and higher than employment growth, but fluctuated. Employment growth was not more than 2% most of the times. Employment growth exceeded 2% in periods including 1999-2005 and 2022-2023.
What the figure shows
Employment and GDP growth
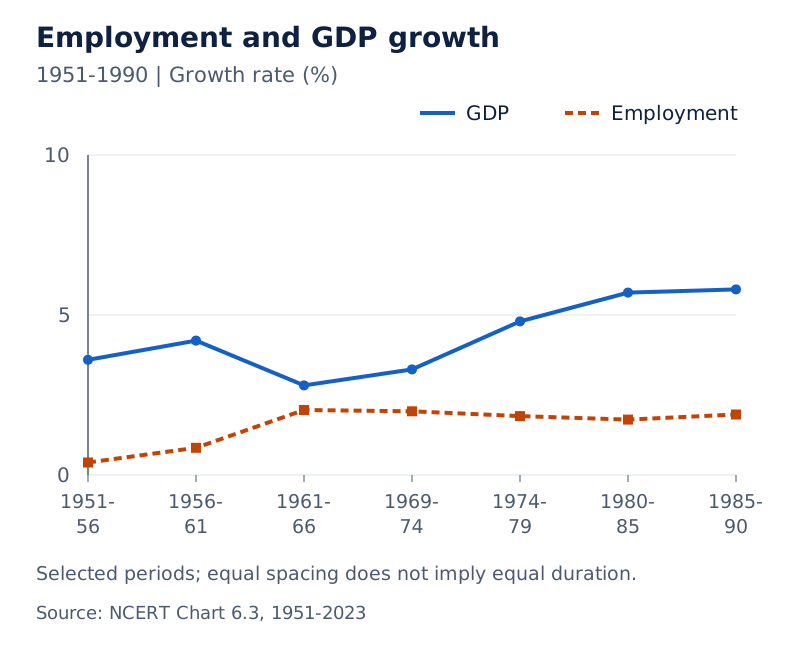
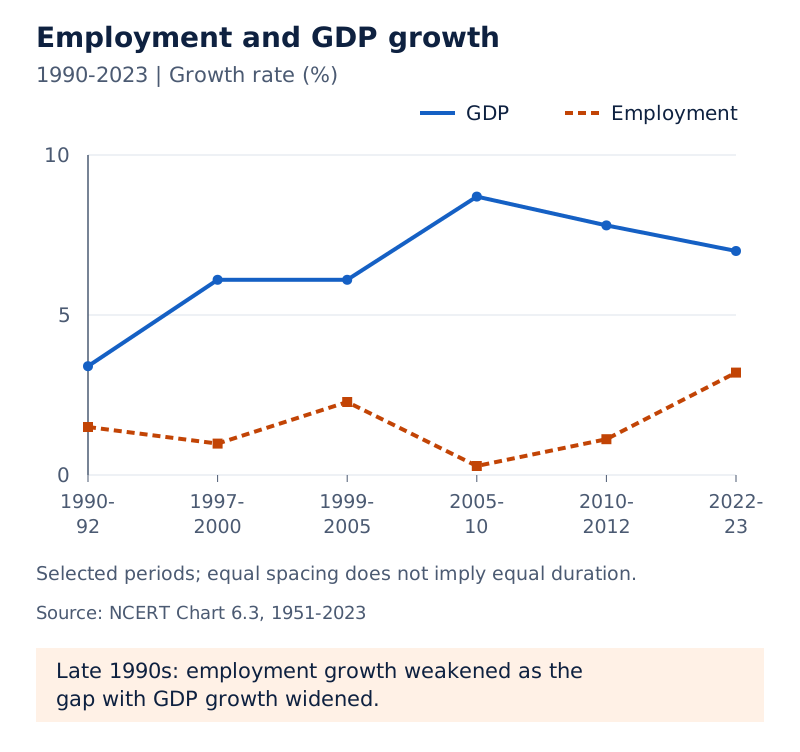
The line graph plots percentage growth rates across periods from 1951-2023. GDP is the upper fluctuating line; employment is the lower line. The late-1990s pattern shows employment growth weakening and a wider gap between the lines.
Drawn by One Young India. Reference: NCERT Class 11 Chart 6.3
In the late 1990s, employment growth declined towards the rate seen in the early planning years. The widening gap with GDP growth illustrates why producing more output cannot be treated as sufficient evidence of employment generation.
Long-term changes in sectors
| Sector | 1972-73 (%) | 1983 (%) | 1993-94 (%) | 2011-12 (%) | 2017-18 (%) | 2023-24 (%) |
|---|---|---|---|---|---|---|
| Primary | 74.3 | 68.6 | 64.0 | 48.9 | 46.1 | 46.1 |
| Secondary | 10.9 | 11.5 | 16.0 | 24.3 | 24.9 | 24.1 |
| Services | 14.8 | 16.9 | 20.0 | 26.8 | 29.0 | 29.8, rounded |
Between 1972-73 and 2023-24, the primary share fell from about 74% to about 46%. Secondary and service shares rose from about 11% and 15% to about 24% and 30%. This represents a substantial shift towards non-farm work.
Casualisation and its limits as a trend
Casualisation of the workforce means movement from self-employment and regular salaried employment towards casual wage work. It makes workers highly vulnerable. The concept must be distinguished from the actual direction shown by particular years of data.
| Status | 1972-73 (%) | 1983 (%) | 1993-94 (%) | 2011-12 (%) | 2017-18 (%) | 2023-24 (%) |
|---|---|---|---|---|---|---|
| Self-employed | 61.4 | 57.3 | 54.6 | 52.0 | 55.6 | 58.4 |
| Regular salaried | 15.4 | 13.8 | 13.6 | 18.0 | 21.1 | 21.7 |
| Casual wage labourers | 23.2 | 28.9 | 31.8 | 30.0 | 23.3 | 19.9, rounded |
The casual share increased between 1972-73 and 1993-94, but fell between 2011-12 and 2023-24. Self-employment remained the major provider, and the regular salaried share rose moderately between 2017-18 and 2023-24. These periods should not be collapsed into a claim of continuous casualisation.
How do formal and informal employment differ?
Formal or organised sector establishments include all public sector establishments and private establishments employing at least ten hired workers. Public sector establishments belong to government; private ones are outside government ownership. Workers in these establishments are formal sector workers under this classification.
Informal or unorganised employment covers the other enterprises and their workers. This includes farmers, agricultural labourers, small enterprise owners and employees, and self-employed people without hired workers. It also includes non-farm casual labourers working for multiple employers, such as construction and headload workers.
What protections distinguish the sectors?
| Basis | Formal employment | Informal employment |
|---|---|---|
| Establishment coverage | All public establishments; private establishments with ten or more hired workers | Other establishments and workers under this classification |
| Income | Regular income and higher earnings | No regular income |
| Social security | Workers enjoy social security benefits | Workers lack the same protection |
| Organisation and rights | Labour laws and trade unions support workers' rights | Dismissal can occur without compensation |
Social security means measures protecting workers against risks affecting their livelihood, health or old age. A trade union represents workers, bargains with employers for better wages and benefits, and may run welfare activities for workers' families.
Benefits discussed include maternity benefit, meaning support connected with childbirth; provident fund, a worker's accumulated savings fund; gratuity, a payment linked to service; and pension, income in retirement. Some workers lack these even after ten to twenty years of work.
Informal enterprises use outdated technology and do not maintain accounts. Workers face insecure living conditions, including slums and squatting, meaning occupying land or accommodation without secure rights. Informalisation concerns the movement towards employment without the security associated with formal work.
Applying the establishment rule
A hotel with seven hired workers and three family workers does not reach the threshold of ten hired workers. A textile shop employing nine workers is also informal under this rule. A police constable and a nurse in a government hospital work in public establishments.
Note: This is one way of classifying workers; other classifications are possible. Do not replace the phrase “ten hired workers” with “ten people”, or assume that every private establishment is informal.
How extensive is informal employment in India?
Development planning expected industrialisation to draw surplus agricultural workers into jobs with better living standards. It also expected the proportion working informally to fall as the economy grew. The scale of informal work shows why employment quality remains a central issue.
Comparing formal and informal numbers
What the figure shows
Workers in formal and informal sectors
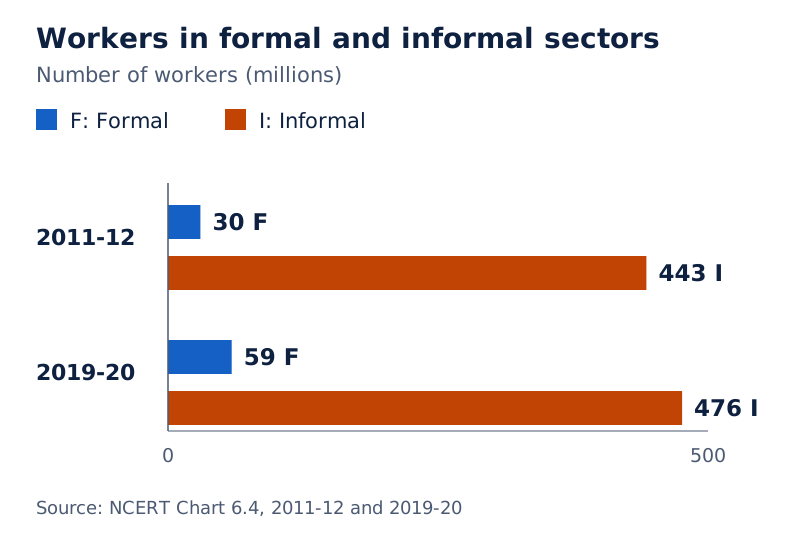
Paired bars show 30 million formal and 443 million informal workers in 2011-12, and 59 million formal and 476 million informal workers in 2019-20. The vertical axis measures numbers of workers in millions.
Drawn by One Young India. Reference: NCERT Class 11 Chart 6.4
In 2019-20, total employment was about 535 million. The formal sector employed about 59 million, so it accounted for about 11% of workers. The remaining approximately 89% worked in the informal sector.
Formal sector share = (Formal workers ÷ Total workers) × 100
Informal sector share = (Informal workers ÷ Total workers) × 100
Worked example 4. In 2019-20, there were about 535 million workers, including 59 million formal workers and 476 million informal workers. Calculate each sector's share.
Answer: Formal share = 59 ÷ 535 × 100, approximately 11%. Informal share = 476 ÷ 535 × 100, approximately 89%. Both calculations use total workers as the denominator.
Keep different years separate
For 2011-12, when gender-wise formal-informal data are available in this comparison, about 20% of formal workers and 30% of informal workers were women. These percentages describe women within each sector, rather than the sectors' shares of all female workers.
In 2012, about 18 million of roughly 30 million formal workers were employed by the public sector. Women made up about one-sixth of that formal workforce. The government was the major formal employer. These figures should retain their own date.
For 2022-23, the workforce estimate was about 545 million, with about two-thirds in rural areas. About 77% were men. This separate estimate must not replace the 2019-20 total in the formal-sector calculation.
What does the Ahmedabad case show about informalisation?
Ahmedabad's textile industry supported the city's prosperity through more than 60 mills employing 1,50,000 workers. Over the course of the century, mill workers had obtained a degree of income security, stable jobs, living wages and protection for health and old age.
From mill employment to informal work
A strong trade union represented workers in disputes and organised welfare activities. These protections made mill employment different from the insecure work into which many displaced workers subsequently moved.
Textile mills across the country began closing in the early 1980s. Closures were rapid in places such as Mumbai. In Ahmedabad, they extended over ten years, making the loss of industrial employment a prolonged process.
Over this period, approximately over 80,000 permanent workers and over 50,000 non-permanent workers lost their jobs and were driven into the informal sector. The city experienced economic recession and public disturbances, especially communal riots.
A whole class of workers moved from middle-class security into poverty. Widespread alcoholism and suicides accompanied the disruption. Children were withdrawn from school and sent to work. The case links employment loss to changes in family life and social conditions.
What the figure shows
Household work after mill closure
The photographs show a man seated on a cot working with garlic and a woman engaged in beedi rolling. The caption identifies an unemployed mill worker and his wife, who has a new beedi-rolling job.
Reference: NCERT Class 11 Box 6.2
Why is employment quality part of the case?
Obtaining some work after dismissal does not restore the lost income security and benefits of mill employment. The case explains why counting workers alone cannot capture the consequences of informalisation. The conditions attached to work matter alongside its availability.
What forms of unemployment occur in India?
Unemployment involves people not working because work is unavailable, while seeking work or expressing willingness or availability to work under prevailing conditions and remuneration. Remuneration means payment for work. The National Statistical Office uses these features to identify unemployment.
Work may be sought through employment exchanges, intermediaries, friends, relatives or applications to employers. An employment exchange registers job seekers for notified vacancies. Rural people may remain at home when work is unavailable rather than visibly searching outside.
How do open, disguised and seasonal unemployment differ?
| Type | Meaning | Illustration |
|---|---|---|
| Open unemployment | People lack work while seeking or being available for it | People approaching factories and offices for vacancies |
| Disguised unemployment | More people work in an activity than it actually requires | A farm employing excess workers and family members |
| Seasonal unemployment | Employment is unavailable during certain parts of the year | Farm workers seeking urban jobs when agricultural work is unavailable |
Consider a farmer with four acres. The farm needs the farmer and two workers, but employs five workers and family members, including the wife and children. This illustrates disguised unemployment. The number of family members is unspecified, so an exact surplus-worker total cannot be calculated.
A study in the late 1950s found about one-third of India's agricultural workers disguisedly unemployed. This is a dated finding, not a present-day estimate. Seasonal unemployment explains why some workers leave villages for jobs and return when the rains begin.
Measurement and the pressure to accept work
One stated identification criterion is inability to obtain even one hour of work in half a day. In the exercise, Victor works two hours daily and seeks work during the remaining time. Under that criterion, he is not completely unemployed, though he seeks additional work.
Employment evidence comes from Census reports, National Statistical Office employment and unemployment reports, Annual Reports of the Periodic Labour Force Survey, and employment-exchange registration data from the Directorate General of Employment and Training. These sources give different estimates and information about unemployed people.
Scholars argue that desperate economic conditions prevent people in India from remaining completely unemployed for very long. They may be forced into unpleasant or dangerous jobs in unhealthy surroundings. Having work does not necessarily mean having satisfactory employment.
How does government generate employment?
Since Independence, Union and State governments have created jobs and opportunities for employment. Their efforts operate directly, by employing workers, and indirectly, by expanding demand and production in other enterprises connected with government activity.
The employment guarantee Act
The Mahatma Gandhi National Rural Employment Guarantee Act 2005 promises 100 days of guaranteed wage employment to all rural households volunteering for unskilled manual work. Unskilled manual work means physical work not requiring specialised skills. The employment promise is expressed for households.
The scheme based on this Act is one of the measures used to generate jobs for people needing employment in rural areas. Its connection with wage employment distinguishes this provision from a general promise of permanent salaried employment.
Direct and indirect generation
- Government directly employs people in administrative departments and in enterprises such as industries, hotels and transport companies.
- A government-owned steel company increases output, bringing a direct increase in employment within that company.
- Private companies purchasing its steel also increase their output.
- Employment consequently expands in those private enterprises, illustrating indirect generation through government initiatives.
What the figure shows
Dam construction and employment
The drawing shows workers carrying baskets of material beside a construction structure. Its caption presents dam construction as a direct way for government to generate employment.
See Fig. 6.7 in your NCERT textbook
Employment programmes and community services
Employment generation programmes also address poverty and provide services. Their areas include primary health, primary education, rural drinking water, nutrition, sanitation and housing. They assist people in acquiring assets that generate income and employment.
Other activities include building community assets through wage employment, assistance for house construction, rural roads and development of wastelands or degraded land. The benefits therefore include both work opportunities and facilities that support people's lives.
Since the late 1970s, developing countries including India have paid attention to informal enterprises and workers. Efforts of the International Labour Organisation (ILO) have encouraged Indian government initiatives for modernising informal enterprises and providing social security measures to their workers.
How are technology and outsourcing changing employment?
Newly emerging jobs are found mostly in services. Service-sector expansion and high technology now frequently allow efficient small enterprises and often individual enterprises or specialist workers to compete alongside multinational companies. A multinational company operates across national boundaries.
What does outsourcing involve?
Outsourcing occurs when a large firm finds it profitable to close some specialist departments and assign numerous small jobs to very small enterprises or specialist individuals. Examples include legal work, computer programming and customer service. Those undertaking the work may sometimes be in other countries.
These changes alter the traditional idea of a factory or office as the workplace. For many people, the home becomes a place of production. Technology has also enabled factory-based goods to be produced in village homes.
What happens to workers' security?
All of these changes have not gone in favour of individual workers. Employment has become more informal, with limited availability of social security. Opportunities for small producers can therefore coexist with insecurity for the people performing the work.
Rapid GDP growth in recent decades has occurred without a simultaneous increase in employment opportunities. This has prompted government initiatives, particularly in rural areas. The central questions remain how much employment is created, who participates, and what conditions accompany the jobs.
Employment analysis consequently connects several measures: participation ratios describe engagement, status distinguishes employment arrangements, sectors locate economic activities, and formal-informal classification examines establishment coverage and protection. Together, they explain more than an employment total alone.
Glossary
- Economic activity — An activity contributing to gross national product through the production of goods or services.
- Worker — A person engaged in economic activity, including self-employed people and helpers of main workers.
- Workforce — The people engaged in economic activities within the population being considered.
- Worker-population ratio — Workers expressed as a percentage of the total population of a particular area.
- Self-employed worker — Someone who owns and operates an enterprise to earn a livelihood.
- Regular salaried employee — A worker engaged by another person or enterprise and receiving wages on a regular basis.
- Casual wage labourer — A worker engaged casually and receiving remuneration for the work performed.
- Jobless growth — Economic growth in which more goods and services are produced without generating employment.
- Casualisation — Movement from self-employment and regular salaried employment towards casual wage work.
- Formal sector — All public establishments and private establishments employing ten or more hired workers.
- Informal sector — Enterprises and workers outside the formal category under the establishment-based classification used here.
- Disguised unemployment — A situation in which an activity engages more workers than it actually requires.
- Seasonal unemployment — Lack of employment during particular parts of the year when work is unavailable.
- Outsourcing — Assigning specialist jobs to small enterprises or individuals instead of retaining the corresponding departments.
Common errors and misconceptions
- Misconception: Only people paid by employers are workers. Correct: Self-employed people and those helping main workers in economic activities also count as workers.
- Misconception: A worker-population ratio measures the proportion of workers who are women. Correct: It divides workers by the relevant population, not by the workforce.
- Misconception: A higher participation ratio proves better employment conditions. Correct: It shows greater engagement; wages, security and conditions require separate examination.
- Misconception: Every private establishment is informal. Correct: Private establishments employing at least ten hired workers are formal under this classification.
- Misconception: Casualisation means that the casual share increased in every period. Correct: It names a process; the casual share actually fell between 2011-12 and 2023-24.
- Misconception: Disguised and seasonal unemployment mean the same thing. Correct: The former concerns excess workers in an activity; the latter concerns lack of work during parts of the year.
- Misconception: The employment guarantee Act promises permanent jobs to every rural individual. Correct: Its stated promise concerns 100 days of wage employment for rural households volunteering for unskilled manual work.
- Misconception: GDP growth necessarily produces matching job growth. Correct: Output and employment can grow differently; jobless growth describes increased production without employment generation.
Exam-style questions with model answers
Q1. Raj attends school and works on his farm outside school hours. Meena manages household chores and also helps in her husband's cloth shop. Explain why each is a worker. [2 marks]
- Raj is a worker because his farm work contributes to economic production, even though he also attends school.
- Meena is a worker because helping in the cloth shop is an economic activity; her household responsibilities do not remove that role.
Q2. In 1999-2000, urban population was 28.52 crore and the urban worker-population ratio was 33.7%. State the calculation and estimate the urban workforce to two decimal places. [2 marks]
- Estimated workforce equals population multiplied by the worker-population ratio and divided by 100: 28.52 × 33.7 ÷ 100.
- The result is 9.61124 crore, or approximately 9.61 crore urban workers.
Q3. Distinguish self-employed workers, regular salaried employees and casual wage labourers. Classify a cement shop owner, a civil engineer regularly employed by a construction company, and a casually hired construction worker. [3 marks]
- A self-employed worker owns and operates an enterprise to earn a livelihood. The cement shop owner belongs to this category.
- A regular salaried employee is engaged by another person or enterprise and receives wages regularly. The company's regularly employed civil engineer illustrates this status.
- A casual wage labourer is engaged casually and receives payment for work done. The casually hired construction worker illustrates this category.
Q4. In 2019-20, total workers numbered about 535 million: 59 million formal and 476 million informal. Calculate the percentage share of each sector, identify the larger sector and explain why these are not worker-population ratios. [4 marks]
- The formal share equals formal workers divided by total workers, multiplied by 100: 59 ÷ 535 × 100, or approximately 11%.
- The informal share is calculated in the same way: 476 ÷ 535 × 100, or approximately 89%.
- The informal sector is much larger, containing 476 million workers compared with 59 million in formal employment.
- Both calculations use total workers as their denominator. A worker-population ratio instead divides workers by the total population of the relevant area.
Q5. A four-acre farm needs its owner and two workers, but employs five workers plus an unspecified number of family members. Identify and explain the unemployment involved, state why an exact surplus cannot be calculated, and distinguish seasonal unemployment. [4 marks]
- The situation illustrates disguised unemployment: an activity has more people engaged in it than are actually required.
- The necessary labour is the owner and two workers. Employing five workers and additional family members exceeds that stated requirement.
- An exact number of surplus workers cannot be calculated because the question does not specify the number of family members employed.
- Seasonal unemployment instead arises when work is unavailable during particular months, as happens outside periods of agricultural activity. It concerns timing rather than excess workers on the farm.
Q6. In Ahmedabad, more than 60 textile mills employed 1,50,000 workers with secure jobs, social protection and a strong union. Closures beginning in the early 1980s extended over ten years, displacing approximately over 80,000 permanent and over 50,000 non-permanent workers into informal work. Explain five consequences or implications of this informalisation. [5 marks]
- Workers lost the secure mill employment on which their livelihoods had depended. Finding informal work did not restore the earlier degree of income security.
- The move undermined the employment setting associated with health and old-age protection, showing why job quality matters alongside the number of people working.
- The city experienced economic recession and public disturbances, especially communal riots, as a large section of its industrial workforce was displaced.
- A whole class of workers moved from middle-class circumstances into poverty. Widespread alcoholism and suicides accompanied the deterioration in their circumstances.
- Children were withdrawn from school and sent to work, showing that the consequences extended beyond dismissed workers to household welfare and education.
Q7. Explain six aspects of government employment generation, covering the Mahatma Gandhi National Rural Employment Guarantee Act 2005, which promises 100 days of wage employment to rural households volunteering for unskilled manual work, direct employment, the government steel-company example of indirect employment, community services and support for informal workers. [6 marks]
- The Act promises 100 days of guaranteed wage employment to rural households volunteering for unskilled manual work, supporting those who need rural jobs.
- Government directly employs workers in administrative departments and enterprises such as industries, hotels and transport companies, creating employment within its own establishments.
- When a government-owned steel company expands output and employment, private firms buying its steel also expand production and jobs, illustrating indirect employment generation.
- Employment programmes also support primary health, primary education, drinking water, nutrition, sanitation and housing, connecting job creation with essential services.
- Programmes help create income-generating and community assets, including rural roads and development of degraded land, while providing opportunities for wage employment.
- Government initiatives encouraged by International Labour Organisation efforts include modernisation of informal enterprises and provision of social security measures for their workers.
Q8. Compare the following workforce shares for 1972-73 and 2023-24 respectively: primary 74.3% and 46.1%; secondary 10.9% and 24.1%; services 14.8% and 29.8%; self-employed 61.4% and 58.4%; regular salaried 15.4% and 21.7%; casual 23.2% and 19.9%. Give six observations, including whether the endpoints show a rising casual share. [6 marks]
- The primary-sector share fell from 74.3% to 46.1%, indicating a substantial reduction in the proportion of workers dependent on primary activities.
- The secondary-sector share increased from 10.9% to 24.1%, showing that this sector accounted for a larger proportion of workers at the later endpoint.
- The service-sector share rose from 14.8% to 29.8%, also indicating a shift in the workforce towards non-farm activities over the period.
- Self-employment fell from 61.4% to 58.4%, but remained above half of all workers and larger than either of the other status categories.
- The regular salaried share increased from 15.4% to 21.7%, so a larger proportion of workers belonged to this category in 2023-24.
- The casual share fell from 23.2% to 19.9%. These endpoints therefore do not support a claim that the casual share rose across the whole period.
Key takeaways
- Workers include self-employed people and helpers in economic activities, as well as employees receiving wages from others.
- The worker-population ratio measures participation in economic activity, while employment status helps assess the nature and quality of work.
- Rural and female workers are more concentrated in primary activities, while services account for the largest urban workforce share.
- Jobless growth separates the expansion of output from employment generation; greater GDP does not establish corresponding growth in jobs.
- Casualisation describes movement towards casual work, but actual employment shares must be compared for clearly identified years.
- Formal employment covers all public establishments and private establishments with at least ten hired workers under this classification.
- The Ahmedabad case connects industrial job losses with informal employment, poverty, household disruption and children leaving school.
- Government creates employment directly and indirectly, while programmes combine wage work with services, assets and support for livelihoods.
Test yourself
Why can a worker absent during a festival still count as employed?
Temporary absence for festivals does not remove a person already engaged in economic activity from the category of workers.
What is the denominator of a worker-population ratio?
The denominator is the total population of the relevant area or group, rather than its total workforce.
Does a hotel with seven hired workers and three family workers meet the formal-sector private-establishment threshold?
No. The threshold is ten hired workers; adding family workers does not make seven hired workers equal ten.
How does casualisation differ from jobless growth?
Casualisation concerns movement towards casual wage employment. Jobless growth concerns increased production without employment generation.
Why is the four-acre farm example disguised unemployment?
The farm engages more workers and family members than the owner and two workers actually needed for its operations.
Why must the late-1950s estimate of disguised unemployment retain its date?
It describes the finding of a historical study, not the present proportion of agricultural workers who are disguisedly unemployed.
What makes the steel-company example an instance of indirect employment generation?
Private firms purchasing steel expand output and jobs following expansion by the government-owned supplier.
What kinds of specialist work may be outsourced?
Legal work, computer programming and customer service may be assigned to small enterprises or specialist individuals.
Try it
Employment: Growth, Informalisation and other Issues | Class 12 Indian Economic Development Notes
Test your understanding of India's employment structure with this 2-step scenario.
1The worker-population ratio measures the proportion of population actively contributing to goods and services production. If this ratio is LOW in a country, what does it indicate?
The worker-population ratio is not about formal vs informal employment. It simply measures how many people out of the total population are working at all.
The text states: 'If the ratio is medium or low, it means that a very high proportion of the population is not directly involved in economic activities.' A low ratio means most people are not working.
The worker-population ratio doesn't tell us which sector dominates employment. It only indicates what fraction of the total population is economically active.
2In India, the workforce is distributed across three major sectors. What does the 'secondary sector' include, and what share of India's workforce does it employ?
Agriculture and Mining fall under the PRIMARY sector, not the secondary sector. The primary sector employs the majority of workers in India.
The text clearly states: 'Secondary sector: includes divisions (iii), (iv) and (v)' which are Manufacturing, Electricity/Gas/Water Supply, and Construction. It adds: 'The secondary sector provides employment to only about 16 per cent of the workforce.'
Trade, Transport, Storage, and Services fall under the SERVICE sector (divisions vi, vii, viii), not the secondary sector. The service sector employs about 24% of workers.
You've completed this scenario. Review the feedback to strengthen your understanding of India's employment structure.