
Loudness, pitch and quality of sound | ICSE Class 10 Physics Notes
On this page

This note covers vibrations and sound waves, amplitude and loudness, intensity and sound level, frequency and pitch, quality and waveforms, musical tones and notes, and noise pollution.
How do vibrations produce the sound that we hear?
A vibration is a repeated to and fro motion of an object. The object producing sound is its source. A stretched rubber band produces sound while vibrating; when its vibration stops, the sound stops.
A medium is the material through which sound travels. In air, the vibrating source produces a disturbance that passes between neighbouring particles. Sound transfers energy through the medium; the particles do not travel from the source to the listener with the disturbance.
What are compressions and rarefactions?
A compression is a region where particles are closer together and the density is above average. A rarefaction is a region where particles are farther apart and the density is below average. Density means mass per unit volume.
A sound wave in air is a longitudinal wave: particles vibrate parallel to the direction in which the disturbance travels. It is also a mechanical wave, meaning that it needs a material medium for propagation, or travel.
These descriptions explain the wave itself. To describe the experience of hearing it, we use loudness, pitch and quality. Loudness describes how loud or soft a sound seems; pitch describes how high or low it seems; quality is the distinctive character that helps distinguish sounds.
How can a sound wave be represented?
A graph can show density on the vertical axis and distance on the horizontal axis at a particular instant. The crest is the highest point of this graph; the trough is its lowest point. They represent maximum and minimum density.
What the figure shows
Compressions and rarefactions on a density graph
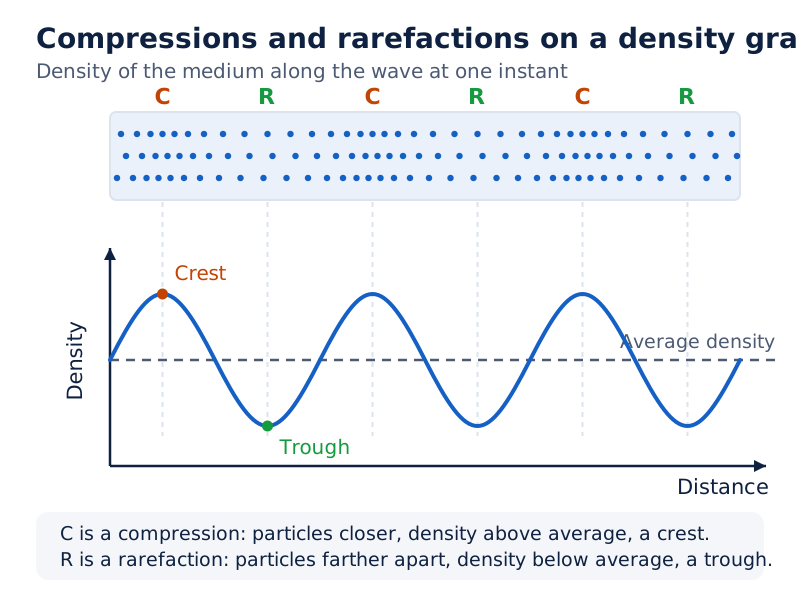
Dense and sparse particle regions appear above a density-distance graph. Compressions labelled C align with crests, and rarefactions labelled R align with troughs. A dashed horizontal line marks average density.
Drawn by One Young India.
The rising and falling line represents changing density. It does not mean that air particles follow a wavy path upwards and downwards. Their sound-related vibration is parallel to the direction of travel of the sound.
How does amplitude affect loudness?
Definition: On a density graph, amplitude is the maximum change in density from the average density in a compression or a rarefaction.
A larger amplitude means that density departs farther from its average value. The crest rises farther above the average-density line and the trough falls farther below it. Amplitude is measured from the average line, rather than from a trough to a crest.
Humans perceive amplitude as loudness. Sounds with larger amplitude are heard louder, while those with smaller amplitude sound softer. This relationship connects a measurable feature of the wave to the listener's experience, but it does not make amplitude and loudness identical quantities.
What happens when a source is struck harder?
A wave with larger amplitude carries more energy than one with smaller amplitude. When a metal plate is struck harder, more energy passes to surrounding particles, which undergo larger displacements from their mean positions. A mean position is the central position about which a particle vibrates.
In a demonstration, grains are placed on a sheet stretched over a container. Sound from a nearby metal plate makes the sheet vibrate without the plate touching it. The grains move because sound has transferred energy to the sheet.
With a harder strike, the sheet moves through a larger displacement and the grains jump higher. This links stronger source vibration, greater energy transfer and larger vibration of the receiving sheet.
What the figure shows
Comparing sound amplitudes
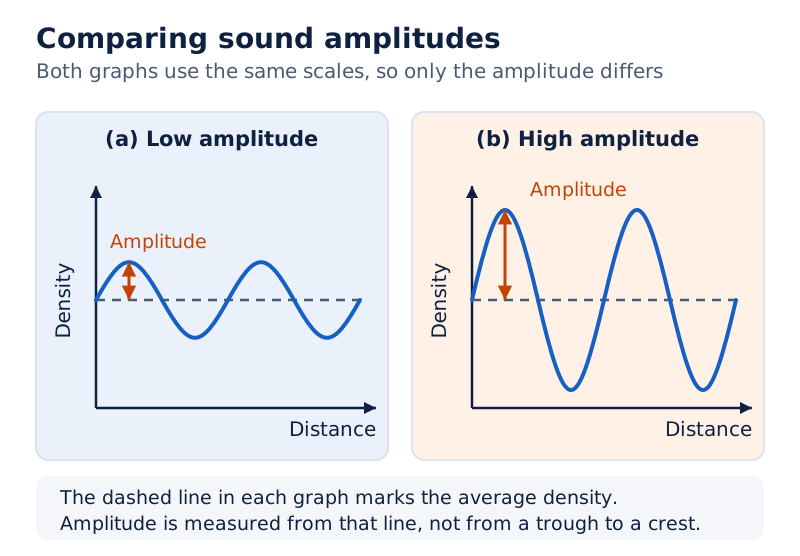
Two density-distance graphs are labelled low amplitude and high amplitude. Each has a dashed average-density line and an amplitude arrow. The high-amplitude curve extends farther above and below its average line.
Drawn by One Young India.
Which change should not be confused with amplitude?
The height of the variation above the average line is different from how often the variation repeats. Increasing amplitude concerns loudness. A change in the repetition rate concerns frequency, the number of complete vibrations per second, and therefore pitch. A graph must be read for both features separately.
How do loudness and intensity differ?
Intensity is the amount of sound energy passing in unit time through unit area perpendicular to the direction of sound propagation. Perpendicular means at right angles. The definition concerns energy transfer through an area, rather than how loud the sound seems to a particular listener.
Let I represent intensity, E the sound energy crossing an area, S that area perpendicular to propagation, and t the time taken. The definition can be written as for the average intensity over that area and time.
The SI unit of intensity is the watt per square metre, written W/m². SI means the International System of Units. A watt is a unit of energy transferred per second; a square metre is a unit of area. Thus intensity expresses energy flow per area.
Why is one objective and the other subjective?
Objective means measurable independently of a person's judgement. Intensity is objective because it describes physical energy transfer. Subjective means dependent on a person's experience. Loudness is subjective because it depends on the listener's hearing ability.
| Basis | Loudness | Intensity |
|---|---|---|
| Meaning | Perceived strength of a sound | Sound energy crossing unit area in unit time |
| Nature | Subjective | Objective |
| Listener | Depends on hearing ability | Defined without a listener's judgement |
| Useful distinction | Describes the hearing experience | Describes measurable energy transfer |
Why does sound become fainter with distance?
As sound spreads away from its source, its energy is distributed over a larger area. The energy available per unit area decreases, so intensity decreases. Loudness also decreases as the listener moves farther from the source.
Note: Loudness and intensity are often used interchangeably in everyday language. In a scientific explanation, distinguish the listener's perception from the measurable energy passing through an area.
Two listeners' reports of loudness need not agree merely because the physical sound is the same. Their hearing abilities matter. Conversely, a change in how someone experiences sound does not by itself establish a change in the sound energy passing through a given area.
What does a sound level in decibels tell us?
Sound level is a way of expressing the strength of sound using the decibel, whose symbol is dB. The number and its unit belong together. A sound level is different from a frequency, which describes how often a sound vibration repeats.
Very soft sounds such as rustling leaves are around a few decibels. Normal conversation is about 60 dB. Very loud sounds such as firecrackers can exceed 100 dB. These descriptions are approximate examples, rather than fixed values for every occurrence of those sounds.
| Sound | Sound-level description | Qualification to retain |
|---|---|---|
| Rustling leaves | Around a few dB | An approximate description of a very soft sound |
| Normal conversation | About 60 dB | About, rather than an exact universal reading |
| Firecrackers | Can exceed 100 dB | Can exceed, rather than invariably equals |
Why should decibel changes be interpreted carefully?
Even a small increase in the decibel level means a large increase in sound intensity. Consequently, simply comparing the printed numbers as ordinary multiples does not describe how many times louder a listener will perceive the sounds.
Keep the three ideas separate: intensity concerns measurable energy transfer, sound level is expressed in decibels, and loudness describes perception. The connection between them does not remove the role of the listener's hearing ability.
How should a sound-level observation be explained?
- Identify the quantity being reported: a sound level, rather than a pitch or a frequency.
- Give the unit as decibel and use its symbol, dB, with the reported value.
- Retain an approximate description such as about or can exceed when that is how the observation is given.
- Discuss the strength of sound without treating the reading as a direct measure of the listener's hearing ability.
A higher sound level is not evidence of a higher pitch. To discuss pitch, information about frequency is needed. The distinction prevents a description of a loud sound from being mistaken for a description of a shrill sound.
How are frequency and time period related?
Frequency is the number of complete density oscillations at a fixed position per unit time. One oscillation is a complete cycle, such as density changing from maximum to minimum and then back to maximum.
The symbol ν, the Greek letter nu, represents frequency. The SI unit of frequency is the hertz, symbol Hz. One hertz means one complete oscillation per second. The symbol s denotes the second, the unit of time.
The time period, represented by T, is the time taken for one complete oscillation at a fixed position. The SI unit of time period is the second. A shorter time period corresponds to a higher frequency.
How can these quantities be calculated?
Let N be the number of complete oscillations counted during time , measured in seconds. Then and . Frequency is measured in hertz and period in seconds.
Derivation: Why is frequency the reciprocal of time period?
Count complete oscillations at a fixed position over a time interval.
- If complete oscillations take time , the time for one oscillation is .
- Taking the reciprocal gives .
- The number of oscillations per second is the frequency, . Therefore .
Result: . A shorter period corresponds to a higher frequency.
Worked example 1. At a given position, 10 density oscillations occur in 2 s. Calculate the frequency and time period.
Formula: and .
Substitute: . Also, .
Answer: The frequency is 5 Hz and the time period is 0.2 s.
The two answers describe the same repetition: five complete cycles occur each second, and each cycle takes one-fifth of a second. The frequency answer must have the unit Hz, while the period answer must have the unit s.
Why does this distinction help when comparing sounds?
Frequency concerns repetition, not the size of the density change. A density variation can extend farther from its average value without its repetition rate changing. Counting complete cycles answers a different question from measuring their amplitude.
Usually, everyday sounds contain a mixture of many frequencies. Nearly single-frequency sounds can be produced by striking a tuning fork or by oral whistling. A tuning fork is a U-shaped metal bar with a stem and two vibrating arms called prongs.
How does frequency determine the pitch we perceive?
Pitch is the human perception of frequency. A shrill sound is described as high-pitched, while a deep sound is described as low-pitched. In general, high-pitched sounds have higher frequencies and low-pitched sounds have lower frequencies, although the exact mathematical relationship is complicated.
A whistle or a siren is an example of a shrill, high-pitched sound. Thunder or an aircraft rumble is an example of a deep, low-pitched sound. These examples concern pitch; calling a sound deep does not describe it as soft.
What does changing frequency demonstrate?
In a classroom demonstration using a sound-generating app, the frequency is set to 100 Hz and then increased in steps of 100 Hz up to 1000 Hz. Listening to the changes helps connect increasing frequency with the change towards higher pitch.
The numerical setting is a frequency measurement. The description of the sound as higher or lower is a perception. The distinction matters because a precise numerical comparison of frequencies should not be turned into an unsupported numerical comparison of perceived pitch.
A musical note contains a combination of frequencies. Its fundamental frequency is the lowest frequency present. An octave is the interval between notes whose fundamental frequencies differ by a factor of two. Notes with fundamental frequencies of 200 Hz and 400 Hz are an octave apart.
Worked example 2. Two musical notes have fundamental frequencies of 200 Hz and 400 Hz. Find their frequency ratio and identify the musical interval.
Answer: The frequency ratio is . The 400 Hz note has twice the fundamental frequency of the 200 Hz note, so the interval is one octave. The ratio has no unit.
Can everyone hear the same range?
The audible range is the range of frequencies humans can hear, from 20 Hz to 20,000 Hz. However, this range varies from person to person and decreases with age. It should not be treated as an identical hearing range for every individual.
A kilohertz, symbol kHz, is one thousand hertz, so 20 kHz means 20,000 Hz. Hearing range describes which frequencies can be heard; loudness describes the perceived strength of a sound that is heard. The two ideas answer different questions.
Why can instruments sound different at the same pitch and loudness?
Quality, also called timbre, is the characteristic that makes sounds distinctive even when musical instruments play the same note at the same loudness. It helps explain why recognising an instrument requires more than identifying how high or loud its sound is.
A flute, ektara and tabla can sound different when playing the same note at the same loudness. Their shapes, materials and construction affect the pattern and intensity of the higher-frequency components in their sounds.
How does a tone differ from a musical note?
A tone is a sound of a single frequency. A tuning fork or oral whistling can produce a nearly single-frequency sound. A musical note, such as a plucked tanpura string or singing, contains a combination of frequencies.
The lowest frequency in this combination is the fundamental. The higher frequencies are called overtones. Together they give a musical note its richness. The pattern and intensity of these overtones contribute to timbre.
| Feature | Tone | Musical note |
|---|---|---|
| Frequency content | A single frequency | A combination of frequencies |
| Components | One frequency component | Fundamental and higher overtones |
| Examples | A nearly single-frequency tuning-fork sound or oral whistle | A plucked tanpura string or singing |
How is quality related to waveform?
A waveform is the shape of the graph representing the sound variation. Sounds with different combinations of frequency components can have different waveforms. Thus matching pitch and loudness does not require the detailed shapes of two sound graphs to match.
What the figure shows
A tone and a singing voice
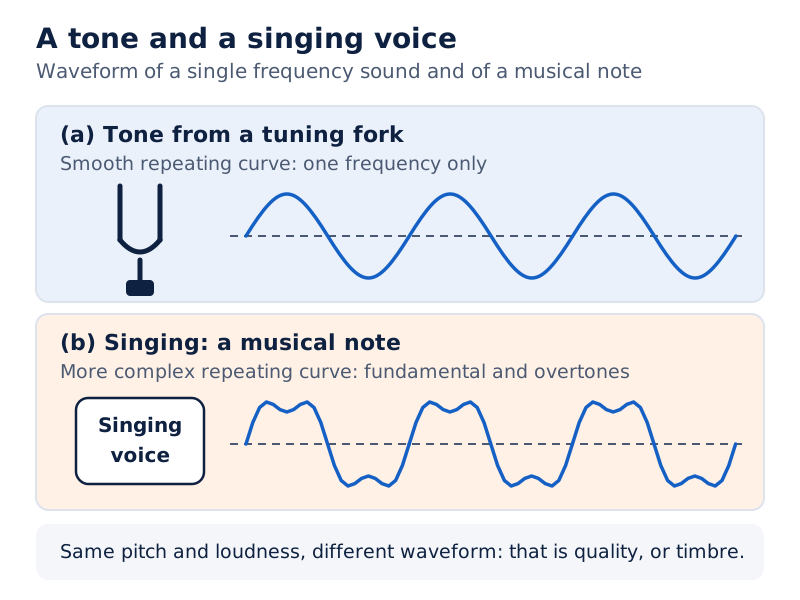
Panel (a) shows a tuning fork beside a smooth repeating curve. Panel (b) shows a child singing beside a more complex curve with smaller variations within its pattern.
Drawn by One Young India.
A single-frequency tone has a smooth, simple waveform. A musical note combines a fundamental frequency with overtones, producing a more complex waveform.
Indian string instruments such as the sarangi, sitar and veena often use extra strings to enrich their combination of frequencies. The extra strings enrich the mixture that contributes to the characteristic sound. The fundamental frequency alone does not describe that mixture or explain all the differences in the sounds of instruments.
How should sound waveforms be compared correctly?
Read the axes and scales before interpreting any sound graph. A density-distance graph shows how density varies across positions at a given instant. A density-time graph shows how density changes with time at one fixed position. The horizontal axes have different meanings.
On either type of graph, density amplitude is the maximum departure from the average density. On a density-time graph, the time between corresponding points of successive cycles is the period. Comparing this interval therefore helps compare frequencies.
What should be checked before drawing conclusions?
- Identify whether the horizontal axis represents distance or time. Do not describe a distance interval as a time period.
- Check that the scales match before comparing the visible heights or spacing of two curves.
- Locate the average-density line and compare the maximum departures from it to compare amplitudes.
- For a time graph, compare complete cycles over equal time intervals to compare frequencies.
- Examine the detailed repeating shape when considering differences in the quality of the sounds.
Wavelength is the distance between consecutive crests or consecutive troughs. It is a distance along the wave, rather than the time for one cycle. Closer crests on a distance graph mean a shorter wavelength, rather than directly giving a numerical frequency.
In most media, such as air, sound speed depends on the medium and not on the source or frequency. If frequency changes, wavelength changes while speed remains constant. This is not a universal rule for every material: some special materials can behave differently.
Derivation: How are speed, wavelength and frequency related?
Write sound speed as and wavelength as . The SI unit of wavelength is the metre (m). The SI unit of speed is the metre per second (m/s). The period is measured in seconds and frequency in hertz.
- A crest travels one wavelength during one complete time period. Thus the distance travelled is and the time taken is .
- Speed is distance divided by time, so .
- Substitute to obtain .
Result: Speed equals wavelength multiplied by frequency. Rearranging gives , and . At constant speed, a higher frequency means a shorter wavelength.
How can these relations be used in calculations?
Worked example 3. Human hearing roughly spans 20 Hz to 20 kHz. Calculate the wavelengths at these two frequencies using a sound speed of 344 m/s in air.
Formula: .
Substitute: At 20 Hz, . At the upper limit, , so .
Answer: The wavelengths are 17.2 m and 0.0172 m respectively. The shorter wavelength is also 1.72 cm.
Worked example 4. A sound wave in steel has a wavelength of 50 m, measured between successive crests on a density-distance graph. Calculate its frequency and time period when its speed is 5000 m/s.
Formula: and .
Substitute: . Then .
Answer: The frequency is 100 Hz and the time period is 0.01 s.
Worked example 5. A source produces a sound wave of wavelength 3.44 m. Find its time period if it travels at 344 m/s.
Formula: .
Substitute: .
Answer: The time period is 0.01 s.
Worked example 6. During a thunderstorm, thunder is heard 5 s after the lightning flash is seen. Estimate the distance to the strike using a sound speed of 340 m/s. Assume that light reaches the observer almost instantaneously.
Formula: , where is the distance in metres, is speed in metres per second and is travel time in seconds.
Substitute: .
Answer: The lightning struck approximately 1700 m away, or 1.7 km.
How can a pitch comparison be drawn?
Diagram
Comparing repetition rates
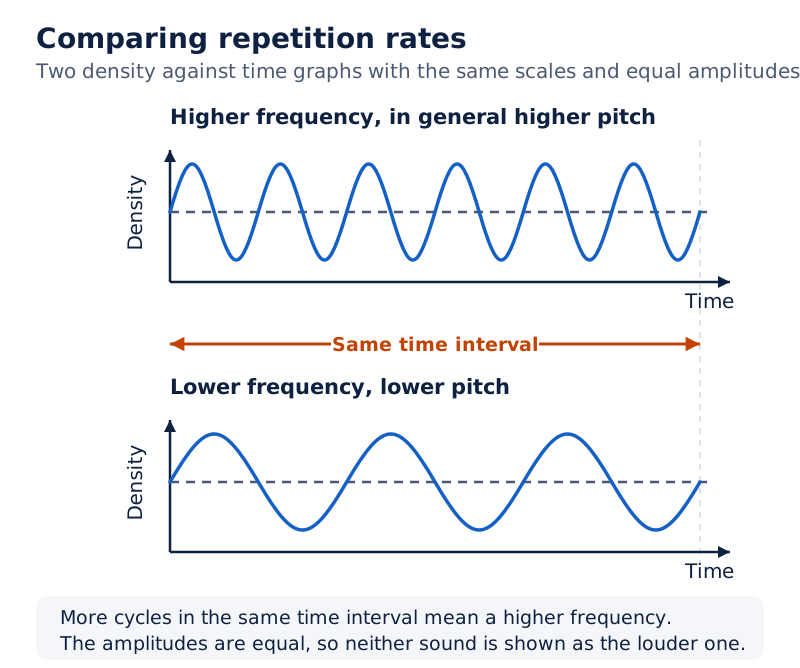
Draw two density-time graphs using the same scales and equal amplitudes. Show more complete cycles within the same time interval on one graph. Label it higher frequency and, in general, higher pitch; label the other lower frequency and lower pitch.
Drawn by One Young India.
For a quality comparison, look beyond height and spacing to the detailed waveform. A curve can have a more complex shape even when the notes being compared have the same pitch and loudness. This is the graphical distinction associated with timbre.
What is noise pollution, and why does exposure matter?
Noise is unwanted or harmful sound. Noise pollution is the presence of unwanted or harmful sound in the surroundings. The word unwanted links noise to the experience of the people hearing it; the word harmful includes its possible effects.
Noise is not defined simply as high pitch. Pitch concerns the perception of frequency, while noise concerns whether sound is unwanted or harmful. Likewise, a description of timbre identifies a sound's character without establishing whether that sound is welcome in its surroundings.
Which aspects of exposure matter?
Exposure to sound levels above recommended limits, especially for long durations, can affect health, sleep and hearing. The statement includes both the sound level and the duration of exposure. Duration means how long the exposure continues.
Prolonged exposure means exposure continuing for a long time. Prolonged exposure to loud sound can lead to hearing loss. The word can matters: it describes a possible consequence without claiming that every individual exposure produces an identical result.
Normal conversation is about 60 dB, while firecrackers can exceed 100 dB. These examples illustrate differences in sound level. They do not by themselves specify a universal safe duration of exposure, and they should not be converted into one.
How can the ideas in this chapter be brought together?
| Question about sound | Relevant idea | What to explain |
|---|---|---|
| How loud or soft does it seem? | Loudness | Amplitude and the listener's hearing ability |
| How much energy crosses an area? | Intensity | Energy per unit area per unit time |
| How high or low does it seem? | Pitch | The general relationship with frequency |
| Why does it sound distinctive? | Quality | Waveform and the pattern of overtones |
| Is it unwanted or harmful? | Noise | The sound and its effect on people |
A complete explanation selects the relevant characteristic rather than calling every difference a change in loudness. When discussing harmful exposure, give attention to sound level and duration, and preserve the distinction between a measurable sound and a person's response to it.
Glossary
- Vibration — Repeated to and fro motion of an object about its central position.
- Compression — A region of a sound wave where density exceeds the average density.
- Rarefaction — A region of a sound wave where density falls below the average density.
- Amplitude — On a density graph, the maximum departure of density from its average value.
- Intensity — Sound energy crossing unit area perpendicular to propagation in unit time.
- Loudness — The perceived strength of a sound, dependent on the listener's hearing ability.
- Decibel — A unit used to express sound level, written with the symbol dB.
- Frequency — The number of complete density oscillations at a fixed position per unit time.
- Time period — The time taken for one complete density oscillation at a fixed position.
- Pitch — The perception of frequency that makes a sound seem high or low.
- Timbre — The distinctive sound quality that differentiates instruments at the same pitch and loudness.
- Waveform — The shape of a graph representing the variation associated with a sound.
- Fundamental frequency — The lowest frequency present in the combination that forms a musical note.
- Overtones — The frequencies above the fundamental that contribute to a musical note's character.
- Noise pollution — The presence of unwanted or harmful sound in the surroundings.
Common errors and misconceptions
- Misconception: Loudness and intensity mean exactly the same thing. Correct: Intensity measures physical energy transfer; loudness is subjective and depends on hearing ability.
- Misconception: A louder sound must have a higher pitch. Correct: Loudness is associated with amplitude, while pitch is the perception of frequency.
- Misconception: Decibels measure frequency. Correct: Sound level is expressed in decibels; frequency is expressed in hertz.
- Misconception: Amplitude is the full height from trough to crest. Correct: It is measured from the average value to the maximum departure on either side.
- Misconception: Matching pitch and loudness makes instruments sound identical. Correct: Their quality can differ because their waveforms and patterns of overtones differ.
- Misconception: Normal conversation always has an exact sound level of 60 dB. Correct: About 60 dB is an approximate description.
- Misconception: A density-distance curve shows air particles moving up and down. Correct: Its vertical axis shows density; particles in an airborne sound wave vibrate parallel to propagation.
- Misconception: Every person has exactly the same hearing range. Correct: The human audible range varies from person to person and decreases with age.
Exam-style questions with model answers
Q1. Distinguish loudness from intensity by stating the meaning and nature of each. [2 marks]
- Loudness is the perceived strength of sound. It is subjective because it depends on the listener's hearing ability.
- Intensity is sound energy crossing unit area perpendicular to propagation in unit time. It is an objective, measurable quantity.
Q2. At a fixed position, 10 complete density oscillations occur in 2 s. Calculate the frequency and time period, giving their units. [2 marks]
- Frequency = number of oscillations ÷ time = 10 ÷ 2 s = 5 Hz.
- Time period = time ÷ number of oscillations = 2 s ÷ 10 = 0.2 s.
Q3. Define pitch, state its general relationship with frequency, and explain why a high-pitched sound need not be louder than a low-pitched sound. [3 marks]
- Pitch is the human perception of frequency, describing whether a sound seems high and shrill or low and deep.
- In general, higher-frequency sounds have higher pitch and lower-frequency sounds have lower pitch, although the exact mathematical relationship is complicated.
- Loudness is associated with amplitude and depends on the listener's hearing ability. A pitch comparison alone does not establish which sound is louder.
Q4. A flute and a tabla play the same musical note at the same loudness, yet sound different. Explain this using quality, fundamental frequency, overtones and waveform. [4 marks]
- The distinguishing characteristic is quality, also called timbre. Matching the note and loudness does not require instruments to sound identical.
- A musical note contains a lowest frequency called the fundamental frequency together with higher-frequency components.
- These higher frequencies are overtones. Instrument shape, material and construction determine their pattern and intensity, contributing to distinctive timbre.
- The different combinations of frequency components give different waveforms. Waveform describes the detailed shape of the sound variation.
Q5. Two density-time graphs have identical axis scales. Their average-density lines, amplitudes and periods are equal, but their detailed repeating shapes differ. Explain what the axes represent and what can be concluded about amplitude, frequency, pitch and quality. [5 marks]
- The horizontal axis represents time and the vertical axis represents density at a fixed position. The curves record how density changes there as the sounds pass.
- Equal amplitudes mean equal maximum departures from average density. There is no difference in density amplitude on which to base a claim that one sound is louder.
- Equal periods mean that complete cycles take equal times. Their repetition frequencies are therefore equal because frequency is the reciprocal of period.
- There is no higher repetition frequency in either graph to support a higher-pitch conclusion. Pitch is the perception associated with frequency.
- The different detailed repeating shapes indicate different waveforms. This is the distinction associated with quality, so sounds can remain distinguishable despite matching pitch and loudness.
Q6. Normal conversation is about 60 dB, while firecrackers can exceed 100 dB. Name the unit, compare these sound-level descriptions, and explain why they do not establish a pitch comparison. [3 marks]
- The unit is the decibel, written dB, which is used to express sound level rather than frequency.
- The given description places firecrackers at a much higher sound level than normal conversation. Retain the qualifications about and can exceed.
- The figures describe sound level. They provide no frequencies, so they do not establish which sound has the higher pitch.
Q7. Define noise and explain the importance of sound level and duration in noise exposure. State a possible consequence of prolonged exposure to loud sound. [4 marks]
- Noise is unwanted or harmful sound. Noise pollution concerns the presence of such sound in the surroundings.
- Exposure to sound levels above recommended limits can affect health, sleep and hearing; the sound level therefore matters.
- Duration also matters, especially when exposure continues for long periods. A sound-level description alone leaves out this part of exposure.
- Prolonged exposure to loud sound can lead to hearing loss. This is a possible consequence, rather than an identical outcome for every exposure.
Q8. A metal plate produces sound near grains resting on a sheet stretched over a container. The plate does not touch the sheet. When the plate is struck harder, the grains jump higher. Explain this in five linked points using vibration, energy transfer and amplitude. [5 marks]
- Striking the metal plate makes it vibrate. The vibrating plate acts as the source of sound and transfers energy to the surrounding air.
- The sound disturbance propagates through the air. Energy is transferred through the medium without air particles travelling from the plate to the sheet with the wave.
- When the sound reaches the stretched sheet, it makes the sheet vibrate. These vibrations move the grains even though the plate has not touched the sheet.
- A harder strike transfers more energy to the surrounding particles, causing larger displacements from their mean positions and producing a larger-amplitude sound wave.
- The receiving sheet then vibrates through a larger displacement, so the grains jump higher. This observation connects stronger source vibration with greater energy transfer.
Key takeaways
- Sound transfers energy through a medium; air particles vibrate about their positions instead of travelling with the disturbance.
- Greater amplitude is associated with greater loudness, but perceived loudness also depends on the listener's hearing ability.
- Intensity measures sound energy crossing unit area perpendicular to propagation in unit time and is objective.
- Sound level is expressed in decibels; normal conversation is about 60 dB and firecrackers can exceed 100 dB.
- Frequency counts complete cycles per unit time, while time period measures the duration of one cycle.
- In general, higher frequency gives higher pitch, although the exact relationship between frequency and perceived pitch is complicated.
- Quality or timbre distinguishes sounds at the same pitch and loudness through waveform and the pattern of overtones.
- Noise is unwanted or harmful sound, and prolonged exposure to loud sound can lead to hearing loss.
Test yourself
Why is loudness called subjective?
It depends on the listener's hearing ability and experience, rather than being simply a measurement of sound energy transfer.
From which line is density amplitude measured?
It is measured from the average-density line to the maximum departure above or below that line.
Why does intensity decrease as sound spreads away from a source?
The sound energy spreads over a larger area, reducing the energy crossing each unit area in unit time.
What distinguishes hertz from decibel?
Hertz is the unit of frequency, whereas decibel is used to express sound level.
How does a shorter time period relate to frequency?
A shorter period means more complete cycles per second and therefore a higher frequency.
What makes a musical note different from a single-frequency tone?
A musical note combines a fundamental frequency with higher overtones, while a tone has a single frequency.
Why can sounds with matching pitch and loudness remain distinguishable?
They can have different quality or timbre because their waveforms and patterns of overtones differ.
Which qualifications belong in a statement about noise and hearing loss?
Prolonged exposure to loud sound can lead to hearing loss. Both the duration and the word can matter.
Write about it
Turn a question from this chapter into a paper.
The Writing Studio has a structure guide, a rubric and citation tools for 15 formats, from essays to research papers. Drafting is free with an account. Learnacy Essential adds feedback from an AI writing coach and submission to The OYI Review.
Publication depends on review and is not guaranteed.