
Collection of Data | CBSE Class 11 Economics Notes
On this page

This note covers data, variables and observations, primary and secondary sources, survey questionnaires, methods of collecting information, pilot surveys, census and sample surveys, random and non-random sampling, sampling and non-sampling errors, and the Census of India and National Sample Survey.
What are data, variables and observations?
Data are economic facts expressed in numbers. Collecting data provides evidence for understanding a problem, explaining it and analysing its causes. Data help a researcher reach a sound and clear solution instead of relying on an unsupported impression.
A variable takes different values. Each value of a variable is an observation. Food grain production, for example, varies from year to year and from crop to crop. Information about these changing values makes it possible to study fluctuations in production.
How do symbols represent the information?
Variables are generally represented by letters such as X, Y or Z. These letters stand for the variables being studied; their meanings must be specified. In the table below, X means the year and Y means food grain production in India, measured in million tonnes.
Table: Production of food grain in India
| X: Year | Y: Production, million tonnes |
|---|---|
| 1970-71 | 108 |
| 1978-79 | 132 |
| 1990-91 | 176 |
| 1997-98 | 194 |
| 2001-02 | 212 |
| 2015-16 | 252 |
| 2016-17 | 272 |
The production observation for 1970-71 is 108 million tonnes; the observation for 2016-17 is 272 million tonnes. The values of X and Y together provide information about production in particular years. A production figure needs its year and unit to convey the intended information.
Note: The selected years in this table do not show every intervening year. Production rose from 108 million tonnes in 1970-71 to 132 million tonnes in 1978-79, but fell to 108 million tonnes in 1979-80.
The purpose of collecting these observations is to understand changes in production. The choice of what to collect follows the problem being investigated. Similarly, the choice of a data source and the way information is collected depend on the objective of the study.
How do primary and secondary data differ?
Definition: Primary data are first-hand information collected by the researcher through an enquiry. Secondary data have already been collected and processed by another agency.
Processing here includes scrutinising, or checking, the information and tabulating, or arranging, it in tables. Secondary data may come from government reports, documents, newspapers, books written by economists or other sources such as websites.
How does the filmstar example explain the distinction?
Suppose a researcher wants to investigate the popularity of a filmstar among school students. The researcher asks questions of a large number of students and collects their responses. Those responses are primary data for the researcher who conducts the enquiry.
If the researcher publishes a report and somebody else uses the collected data for a similar study, they become secondary data for that later user. The distinction therefore concerns who first collects and processes the information and who subsequently uses it.
Table: Comparison of primary and secondary data
| Basis | Primary data | Secondary data |
|---|---|---|
| Origin | First-hand enquiry by the researcher | Earlier collection and processing by another agency |
| Filmstar example | Responses collected directly from school students | Responses used later from the published report |
| Obtaining information | Conducting the enquiry | Using available reports, documents, books or other sources |
Using secondary data saves time and cost. The later researcher can use information that has already been collected and processed. The same observations can be primary for their original collector and secondary for another researcher; these labels do not describe two necessarily different sets of numbers.
A survey is a method of gathering information from individuals. It can describe product characteristics such as price, quality and usefulness, or characteristics of a political candidate such as popularity, honesty and loyalty. Its purpose is to collect data relevant to the enquiry.
How should a survey questionnaire be prepared?
A questionnaire or interview schedule is an instrument containing survey questions. A respondent is the person answering them. An enumerator is the researcher or investigator who administers the questions and collects information. Respondents may also complete a questionnaire themselves.
What makes the wording and sequence suitable?
The questionnaire should be short, with as few questions as possible, and easy to understand. Difficult or ambiguous words should be avoided. Questions should be arranged so that the respondent feels comfortable, moving from general questions towards more specific ones.
- Begin with the general issue. Ask whether electricity supply in the locality is regular before asking whether an increase in electricity charges is justified.
- Keep the question precise. Ask what percentage of income is spent on clothing. Adding “in order to look presentable” makes the question less clear and precise.
- Avoid vague expressions. Asking whether somebody spends “a lot” on books leaves the amount unclear. Ask how much is spent on books in a month.
- Avoid negative openings. Questions beginning “Wouldn’t you” or “Don’t you” may lead to biased responses, meaning answers influenced by the wording of the question.
- Avoid leading wording. A leading question suggests how the respondent should answer. Ask about the flavour of tea without describing the tea as “high-quality”.
- Avoid restricting an open enquiry prematurely. Ask what someone would like to do after college, rather than presenting only a job or becoming a housewife as the alternatives.
How can unclear questions be improved?
The question about prohibiting smoking illustrates the effect of wording. “Do you think smoking should be prohibited?” avoids the negative opening in “Don’t you think smoking should be prohibited?” The subject remains the same, but the question no longer begins by suggesting agreement.
Table: Improving survey questions
| Problem | Unsuitable wording or order | Improvement |
|---|---|---|
| Sequence | Electricity charges before regularity of supply | Regularity of supply before justification of higher charges |
| Precision | Clothing expenditure “in order to look presentable” | Percentage of income spent on clothing |
| Ambiguity | Spending “a lot” on books | Amount spent on books in a month |
| Leading description | Flavour of “high-quality tea” | Flavour of the tea |
Clarity helps respondents answer quickly, correctly and clearly. Careful preparation concerns both the individual question and its place in the sequence. An understandable question can still be placed poorly if the questionnaire introduces a specific judgement before establishing the more general situation.
How do question types and a pilot survey improve an enquiry?
Closed-ended questions, also called structured questions, offer answers from which respondents choose. Open-ended questions, also called unstructured questions, allow respondents to frame their own answers. Choosing between them affects both the freedom of response and the work of interpreting answers.
What are the advantages and limitations of each type?
A two-way question has two possible answers, such as yes and no. A multiple-choice question offers more than two possible answers. For a question about why someone sold land, the alternatives include repaying debts, financing children’s education, investing in another property and “Any other”.
Closed-ended questions are easy to use, score and codify, meaning to assign codes for analysis. All respondents can select from the available options. However, the alternatives are difficult to write: they need to be clear and represent both sides of the issue.
A respondent’s true answer may be absent from the alternatives. An “Any other” option provides space for a response the researcher did not anticipate. Multiple-choice questions also tend to restrict answers; without the alternatives, respondents may have answered differently.
Open-ended questions allow more individualised responses. Asking what a student would like to do after college is one example. However, the variety of responses makes them difficult to interpret and hard to score. Greater freedom in answering therefore comes with a difficulty in analysis.
What does pre-testing check?
Definition: A pilot survey is a try-out of a prepared questionnaire with a small group. It is also called pre-testing of the questionnaire.
Once the questionnaire is ready, it is advisable to conduct this trial. The pilot survey gives a preliminary idea of the enquiry and reveals shortcomings in questions before the actual survey. It assesses more than the wording alone.
- Suitability of questions: whether the questions are appropriate for the enquiry.
- Clarity of instructions: whether respondents can understand what they are being asked to do.
- Performance of enumerators: how the investigators carry out their work during the trial.
- Cost and time: the resources and time involved in carrying out the actual survey.
Question design and pre-testing belong together. Preparing a short, clear questionnaire is the first task; trying it with a small group helps reveal drawbacks that may not have been apparent during preparation.
What are the advantages and limitations of data collection methods?
The three basic methods are personal interviews, mailing questionnaires and telephone interviews. They differ in the contact between investigator and respondent, the opportunity to clarify questions, the cost and time involved, and the people the investigator can reach.
When are personal interviews useful?
In a personal interview, the investigator meets the respondent face to face. This method is used when the researcher has access to all the members. Direct contact allows the interviewer to explain the study and answer the respondent’s queries.
The investigator can request fuller answers on particularly important matters. Misinterpretation and misunderstanding can be avoided through explanation. Watching a respondent’s reactions can provide supplementary information, meaning additional information beyond the spoken answer.
The method is expensive because trained interviewers are required, and completing the survey takes longer. The researcher’s presence may inhibit respondents from saying what they really think. Direct contact is therefore both a source of clarification and a possible influence on answers.
What are the advantages and limitations of mailed questionnaires?
A questionnaire is sent by mail with a request that it be completed and returned by a specified date. This method is less expensive and can reach people in remote areas who might be difficult to contact personally or by telephone.
The interviewer cannot influence the respondent in person, and respondents have sufficient time to give thoughtful answers. However, there is less opportunity to clarify instructions. Misunderstanding the questions is therefore possible, and the researcher cannot watch respondents’ reactions.
Mailing is also likely to produce low response rates. The response rate concerns how many of those approached return answers. Questionnaires may be returned incomplete, not returned at all, or lost in the mail. People unable to read cannot use this method themselves.
How do telephone interviews compare?
In telephone interviews, investigators ask questions over the telephone. These interviews are cheaper than personal interviews and take less time. Investigators can clarify questions, and the method is better where respondents are reluctant to answer certain questions in personal interviews.
The limitation is access: many people may not own telephones. The investigator cannot observe reactions, and there is a possibility of influencing respondents. Thus, the opportunity to explain a question does not remove every difficulty in obtaining information.
Table: Comparison of collection methods
| Method | Useful feature | Limitation |
|---|---|---|
| Personal interview | Clarification and observation of reactions | Expense, more time and possible inhibition of answers |
| Mailed questionnaire | Time for thoughtful answers and access to remote areas | Limited clarification and likely low response rates |
| Telephone interview | Quicker and cheaper than personal interviews, with clarification | Access limited by telephone ownership |
The objective of the study guides the choice of method. The investigator must consider how the required information can be obtained from the intended respondents. No single advantage, such as lower expense, removes the limitations associated with the same method.
How do a census, a population and a sample differ?
The population, or universe, is the totality of items under study. It consists of all individuals or items possessing the characteristics relevant to the survey’s purpose. The results of the study are intended to apply to this group.
A census, or complete enumeration, covers every element of the population. A sample is a group or section of the population from which information is obtained. Identifying the population is the first task before selecting a sample.
What makes a sample useful?
A representative sample is capable of providing reasonably accurate information about its population. A good sample is generally smaller than the population and provides such information at a much lower cost and in a shorter time. Representativeness matters alongside the number of items selected.
To find the average income of people in a region by census, collect each individual’s income, add the incomes and divide by the number of individuals. An average here is the total income divided by the number of people whose incomes are included.
Alternatively, collect the incomes of a representative group and calculate its average. This sample average serves as an estimate, or an approximation based on the sample, of the average income of the entire region. The census approach would require huge expenditure on enumerators.
Most of the surveys are sample surveys. A sample can provide reasonably reliable and accurate information at lower cost and in less time. Its smaller size permits intensive enquiries, through which more detailed information can be collected.
A smaller team of enumerators is also easier to train and supervise effectively. These advantages explain the preference for sample surveys. They do not mean that any conveniently chosen group will provide a sound picture of the population.
How can population and sample be identified?
Worked example 1. A village contains 200 farms. A study of cropping patterns surveys 50 farms, of which 50 per cent grow only wheat. Identify the population and sample size.
Answer: The population is all 200 farms in the village. The sample is the 50 farms surveyed, so its size is 50. The proportion growing only wheat describes the surveyed farms; it does not change the sample size.
For a study of the economic condition of agricultural labourers in Churachandpur district of Manipur, the population is all agricultural labourers in the district. A sample can consist of ten per cent of those labourers. The population follows the research problem.
How are random and non-random samples selected?
Random sampling selects units so that every individual has an equal chance of selection. A sampling unit is an individual item considered for selection, such as a household. The collection of units from which the sample is selected is the sampling frame.
How does the lottery method work?
Worked example 2. The government wants to study the effect of higher petrol prices on household budgets in a locality containing 300 households. Explain how to select a random sample of 30 households.
Answer: Write the names of all 300 households on paper, mix them and select 30 names one by one. Interview the selected households. The lottery method gives all 300 household units an equal chance of inclusion in the sample of 30.
- Identify the population: include all households in the locality concerned.
- Prepare the names: write the names of all 300 households on paper.
- Mix the names: make the selection by lottery, rather than choosing familiar households.
- Draw the sample: select 30 names one by one for interview.
Computer programmes are also used to select random samples. The essential feature remains the chance of selection. Calling a method random is not enough if the investigator’s preference determines which households enter the sample.
What changes in non-random sampling?
In non-random sampling, all units do not have an equal chance of selection. The investigator’s judgement or convenience plays an important role. Samples may be selected on the basis of judgement, purpose, convenience or quota, meaning a specified share to be selected.
Worked example 3. An investigator selects 10 of 100 households because they are conveniently located or known to the investigator or a friend. Identify the sampling method and explain the reason.
Answer: This is non-random sampling. Selection of the 10 households depends on convenience or judgement, rather than giving all 100 households an equal chance. Knowing the households or finding them easy to reach influences their inclusion.
What the figure shows
Representative and non-representative samples
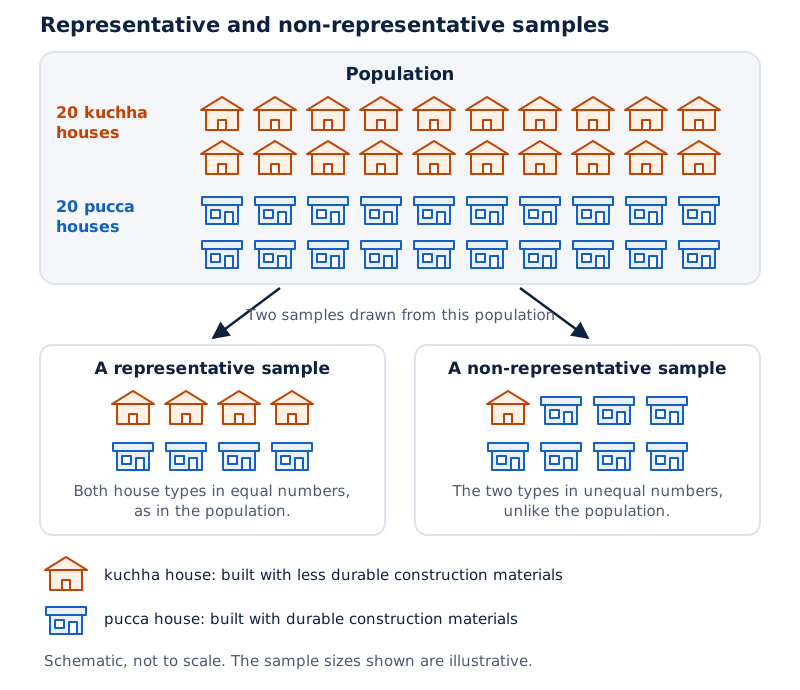
A large box contains a population labelled 20 kuchha and 20 pucca houses. Arrows lead to a representative sample containing both house types in equal numbers and a non-representative sample containing unequal numbers of the two types.
Drawn by One Young India. Reference: NCERT Class 11, unnumbered illustration, page 17
Here, kuchha houses are houses built with less durable construction materials, while pucca houses use durable construction materials. The illustration compares the composition of the samples with the composition of the population. A sample should be considered in relation to the population it is meant to represent.
Exit polls ask a random sample of voters leaving polling booths whom they voted for. Television networks use these sample responses to predict results. Exit polls do not always predict correctly, which illustrates why a sample-based prediction is not a guaranteed result.
What is sampling error and how is it calculated?
Two characteristics of numerical populations are central tendency, the central or typical value, and dispersion, the spread of values. Measures of central tendency include the mean, median and mode. Measures of dispersion include standard deviation, mean deviation and range.
The mean is the arithmetic average; the median is the middle value of ordered observations, or the average of the two middle values when their number is even; and the mode is the most frequent value. These describe a population in different ways.
The range is the difference between the largest and smallest values. Standard deviation is the square root of the average squared deviations from the mean; mean deviation averages distances from a central value, ignoring their signs. A deviation is a difference from the reference value.
A population parameter is the actual value of a characteristic of the population, such as its average income. A sample estimate is the value calculated from a sample to estimate that characteristic. Obtaining estimates of population parameters is a purpose of sampling.
Definition: Sampling error is the difference between a sample estimate and the corresponding population parameter. It is possible to reduce the magnitude of sampling error by taking a larger sample.
How does the farmers’ income example work?
Worked example 4. The incomes of five farmers in Manipur are 500, 550, 600, 650 and 700. A sample contains the two incomes 500 and 600. Calculate the population average, sample average and sampling error.
Answer: Population average = (500 + 550 + 600 + 650 + 700) ÷ 5 = 3000 ÷ 5 = 600. Sample average = (500 + 600) ÷ 2 = 1100 ÷ 2 = 550. Sampling error = 600 − 550 = 50.
The symbol x, if used for this example, represents farmers’ income. The numbers 500, 550, 600, 650 and 700 are its observations. The population contains five observations, while the selected sample contains two of them.
- Add all population incomes. Their total is 3000, using the five given values.
- Find the population average. Divide 3000 by 5 to obtain the actual average of 600.
- Find the sample average. Add 500 and 600, then divide 1100 by 2 to obtain 550.
- Compare the values. Subtract the sample estimate of 550 from the actual population average of 600 to obtain 50.
The sample estimate is lower than the actual average in this example. The difference is not caused by a stated recording mistake; it arises when the average of the selected sample is compared with the average of the entire population.
Note: Preserve the direction of subtraction used here: actual population value minus sample estimate. Do not confuse the sample total, 1100, with the sample average, 550.
A larger sample can reduce sampling error. This does not mean that increasing sample size removes every kind of error in a survey. Errors caused by excluded groups, missing responses or incorrect recording require a separate distinction.
Why are non-sampling errors more serious?
Non-sampling errors include errors arising from bias in selection, non-response and data acquisition. They are more serious than sampling errors because it is difficult to minimise them even by taking a large sample. Even a census can contain non-sampling errors.
What forms can these errors take?
Sampling bias occurs when the sampling plan prevents some members of the target population from possibly entering the sample. The target population is the group the enquiry intends to study. The problem lies in the plan’s exclusion of members.
Non-response occurs when an interviewer cannot contact somebody listed in the sample or when a selected person refuses to answer. In this case, the sample observation may not be representative. Selecting someone does not ensure that information is obtained from that person.
Errors in data acquisition arise from recording incorrect responses. When students measure the length of a classroom table, measurements may differ because of differences in measuring tapes or students’ carelessness. This concerns the collection of the observations themselves.
Recording or transcribing, meaning copying, can also introduce errors. An enumerator or respondent may write 13 instead of 31. Increasing the number of people surveyed does not by itself correct an incorrectly recorded number.
Table: Sampling and non-sampling errors compared
| Basis | Sampling error | Non-sampling error |
|---|---|---|
| Meaning | Difference between sample estimate and actual population parameter | Errors from selection bias, non-response or data acquisition |
| Larger sample | Can reduce its magnitude | Difficult to minimise even with a large sample |
| Example | Population average 600 compared with sample average 550 | Recording 13 instead of 31 |
Why does the nature of the information matter?
Prices of oranges vary across shops, markets and qualities. An enquiry into orange prices therefore considers average prices. Care is needed in obtaining the information, because differences in what is measured and mistakes in recording are distinct issues.
The key distinction is between an estimate differing from a population value and difficulties in obtaining or recording the information. A survey may have a carefully chosen sample and still encounter missing responses or data acquisition errors.
How do the Census of India and National Sample Survey provide data?
Agencies at national and state levels collect, process and tabulate statistics. Important national sources include the Census of India and the National Sample Survey (NSS). Their information helps in studying economic and social conditions and can be used as secondary data.
What information does the Census provide?
The Census provides the most complete and continuous demographic record, meaning information about the population and its characteristics. House-to-house enquiries cover rural and urban households. Information includes population size and composition, meaning the number of people and the groups making up the population. It also covers birth and death rates, the frequency of births and deaths relative to the population.
Other information includes literacy, the ability to read and write with understanding; employment, engagement in work; and life expectancy, the average number of years a person is expected to live under given mortality conditions, or patterns of death.
The Registrar General of India publishes demographic data. Census information also covers population density, the number of people per unit area; sex ratio, the relative numbers of females and males; and migration, movement of people between places, as well as rural-urban distribution.
The Census is a decennial enquiry, meaning an enquiry conducted every ten years. The regular Census series began in 1881. The first Census after Independence was conducted in 1951. Census 2011 recorded a population of 121.09 crore, compared with 102.87 crore in 2001 and 23.83 crore in 1901. Population increased by more than 97 crore over the 110 years from 1901 to 2011.
The average annual population growth rate was 2.2 per cent in 1971-81, 1.97 per cent in 1991-2001 and 1.64 per cent in 2001-2011. These figures describe the stated periods; they are not observations for the present year.
What does the NSS collect and publish?
The Government of India established the NSS for nationwide surveys on socio-economic issues, meaning issues involving social and economic conditions. It carries out continuous surveys in successive rounds, or survey cycles. Results appear in reports and the quarterly journal Sarvekshana.
Its periodic estimates cover literacy, school enrolment, use of educational services, employment, unemployment, being without work while seeking or available for it, and manufacturing and service enterprises, meaning businesses producing goods or providing services. They also cover morbidity, meaning illness, maternity and childcare, and use of the public distribution system, through which essential goods are distributed to people.
The NSS 60th round, from January to June 2004, studied morbidity and healthcare. The 68th round, in 2011-12, studied consumer expenditure, meaning spending by consumers. The NSS also collects information on industrial activities and retail prices of goods for government planning.
These sources illustrate how data collected by an agency become available to later users. The researcher must connect the objective of the enquiry with the information required, the available source and the appropriate method of collection.
Glossary
- Data — Economic facts expressed in numbers, used to understand, explain and analyse a problem.
- Variable — A characteristic whose values vary, such as food grain production across different years.
- Observation — An individual value of a variable, such as production recorded for a particular year.
- Primary data — First-hand information collected by a researcher through an enquiry for the study.
- Secondary data — Information previously collected and processed by another agency and used by a later researcher.
- Respondent — The individual who supplies information by answering the questions in a survey.
- Pilot survey — A trial of a prepared questionnaire with a small group to identify shortcomings.
- Population — The totality of individuals or items to which the results of a study are intended to apply.
- Census — A survey covering every individual or item belonging to the population under study.
- Representative sample — A selected group capable of providing reasonably accurate information about the population it represents.
- Random sampling — Selection in which every individual unit of the population has an equal chance of inclusion.
- Population parameter — The actual value of a population characteristic, such as the average income of its members.
- Sampling error — The difference between a sample estimate and the corresponding actual value of the population parameter.
- Non-response — Failure to obtain information because a selected person cannot be contacted or refuses to answer.
- Sampling bias — A defect in the sampling plan that prevents some population members from possibly being included.
Common errors and misconceptions
- Misconception: Information collected directly by the investigator is secondary data. Correct: It is primary data for the collector; it becomes secondary for another researcher using the collected and processed information.
- Misconception: A population means only the residents of a country. Correct: In statistics, it means all the individuals or items relevant to the study, including farms or households.
- Misconception: A sample is random merely because it contains few units. Correct: Random sampling requires an equal chance of selection for every unit, rather than selection through convenience or personal preference.
- Misconception: Closed-ended questions have no drawbacks. Correct: A true response may be missing from the options, and the supplied alternatives tend to restrict how people answer.
- Misconception: Mailed questionnaires guarantee complete responses. Correct: They are likely to have low response rates because questionnaires may be incomplete, unreturned or lost.
- Misconception: Taking a larger sample removes non-sampling errors. Correct: These errors are difficult to minimise even with a large sample; incorrect recording and non-response remain possible.
- Misconception: A census cannot contain errors because everyone is covered. Correct: Even a census can contain non-sampling errors, including problems in acquiring and recording data.
Exam-style questions with model answers
Q1. Distinguish between primary and secondary data. [2 marks]
- Primary data are first-hand information collected by the researcher through an enquiry.
- Secondary data have already been collected and processed by another agency and are used by a later researcher.
Q2. A village has 200 farms. A cropping-pattern study surveys 50 farms, and 50 per cent of those surveyed grow only wheat. Identify the population and the sample size. [2 marks]
- The population is all 200 farms in the village, because these are the farms covered by the research problem.
- The sample size is 50 farms. The wheat-growing percentage describes those surveyed and does not alter the number selected.
Q3. Explain three benefits of conducting a pilot survey before the actual survey. [3 marks]
- A pilot survey tries the questionnaire with a small group. It reveals shortcomings in the questions and helps assess whether they are suitable for the enquiry.
- It checks the clarity of instructions and the performance of enumerators, giving a preliminary idea of how the survey will operate.
- It helps assess the cost and time involved in the actual survey, providing information for planning the enquiry.
Q4. Explain two advantages and two limitations of personal interviews. [4 marks]
- Personal contact lets the interviewer explain the study, answer queries and clarify questions, helping avoid misinterpretation and misunderstanding.
- The interviewer can request fuller answers on important matters and observe reactions that provide supplementary information.
- The method is expensive because it requires trained interviewers, and completing the survey takes longer.
- The investigator’s presence may inhibit respondents from expressing what they really think, so direct contact can influence the information obtained.
Q5. A locality contains 300 households. A study of the effect of higher petrol prices on household budgets requires a random sample of 30. Explain the lottery procedure and why it is random. [4 marks]
- Identify all 300 households in the locality as the population from which the required sample will be selected.
- Write the names of all 300 households on paper so that every household is included in the selection process.
- Mix the names and select 30 names one by one, then interview the households selected.
- This is random sampling because all 300 household units have an equal chance of inclusion, instead of being chosen for convenience or familiarity.
Q6. Five farmers have incomes of 500, 550, 600, 650 and 700. A sample contains incomes of 500 and 600. Calculate the population average, sample average and sampling error, using actual value minus estimate. Explain the result in six steps. [6 marks]
- The population consists of all five farmers. Its total income is 500 + 550 + 600 + 650 + 700 = 3000.
- The population average is the total divided by the number of farmers: 3000 ÷ 5 = 600. This is the actual population value.
- The sample contains two farmers with incomes of 500 and 600. Their combined income is 500 + 600 = 1100.
- The sample average is 1100 ÷ 2 = 550. It serves as an estimate of the average income of all five farmers.
- Sampling error, using the stated subtraction order, is the actual population average minus its estimate: 600 − 550 = 50.
- The sample average is therefore 50 below the population average. This difference illustrates sampling error; taking a larger sample can reduce its magnitude.
Q7. Explain why non-sampling errors are more serious than sampling errors. Include sampling bias, non-response and errors in data acquisition in your answer. [5 marks]
- Sampling error is the difference between a sample estimate and its population parameter. Its magnitude can be reduced by taking a larger sample.
- Non-sampling errors are difficult to minimise even with a large sample. They are therefore more serious, and even a census can contain them.
- Sampling bias arises when the sampling plan makes it impossible for some members of the target population to be included in the sample.
- Non-response arises when a selected person cannot be contacted or refuses to answer. The resulting sample observation may not be representative.
- Errors in data acquisition arise from recording incorrect responses. Measurement difficulties, carelessness, or mistakes while recording and transcribing information can produce such errors.
Q8. Explain three features of the National Sample Survey as a source of secondary data. [3 marks]
- The Government of India established the National Sample Survey to conduct nationwide enquiries into socio-economic issues. Its surveys continue in successive rounds.
- It publishes collected data through reports and its quarterly journal, Sarvekshana, making the information available for subsequent use.
- It provides periodic estimates on topics including literacy, employment and unemployment, and collects industrial and retail-price information used for government planning.
Key takeaways
- Data provide evidence for understanding economic problems; variables take different values, and each individual value is an observation.
- Primary data come from first-hand enquiry, while secondary data have already been collected and processed by another agency.
- A suitable questionnaire is short, clear and carefully ordered, and avoids ambiguous, negative or leading wording.
- Personal, mailed and telephone surveys differ in cost, time, access, clarification and possible influence on respondents.
- A census covers the whole population; a representative sample can provide reasonably accurate information at lower cost.
- Random sampling gives every unit an equal chance, whereas non-random selection depends on judgement, purpose, convenience or quota.
- Larger samples can reduce sampling error, but non-sampling errors remain difficult to minimise and can affect a census.
- The Census of India and National Sample Survey collect, process and publish information about important economic and social issues.
Test yourself
What does an observation mean?
An observation is an individual value of a variable, such as food grain production recorded for a particular year.
Can the same information be primary for one researcher and secondary for another?
Yes. It is primary for the researcher who first collects and processes it, and secondary for a later user.
Why provide an “Any other” option in a multiple-choice question?
A respondent’s true answer may be absent from the given options. This choice allows a response not anticipated by the researcher.
What is tried out in a pilot survey?
A prepared questionnaire is tried with a small group to assess questions, instructions, enumerators’ performance, cost and time.
What makes a lottery sample random?
Every individual unit in the population has an equal chance of being selected for the sample.
A population average is 600 and its sample estimate is 550. What is the sampling error using actual value minus estimate?
The sampling error is 600 − 550 = 50. The sample estimate is lower than the actual population average.
What is the difference between non-response and a recording error?
Non-response means a selected person cannot be contacted or refuses to answer. A recording error means information is entered incorrectly.
Why does complete enumeration not guarantee freedom from error?
Even a census can contain non-sampling errors arising from difficulties in acquiring or recording the information.
Write about it
Turn a question from this chapter into a paper.
The Writing Studio has a structure guide, a rubric and citation tools for 15 formats, from essays to research papers. Drafting is free with an account. Learnacy Essential adds feedback from an AI writing coach and submission to The OYI Review.
Learnacy Essential is ₹1,499 for the year. Publication depends on review and is not guaranteed.