
Representation of Geographical Features | ICSE Class 7 Geography Notes
On this page

This note covers topographical sheets, map colours, conventional signs and symbols, directions, representative fractions, linear scales, measurement of straight and curved distances, and the use of these skills to read and draw maps.
What does a topographical sheet show?
A map represents the whole or part of the Earth's surface at a reduced size. It shows the surface as though viewed from above. A topographical sheet, also called a topographical map, shows detailed natural and human-made features of an area.
These maps are drawn at relatively large scales. A scale expresses the relationship between a distance on the map and the corresponding distance on the ground. It lets a small drawing represent a much larger area while preserving a measurable relationship between distances.
Which features can you recognise?
Natural features include water bodies, vegetation and relief. Water bodies are features containing water; vegetation is plant cover; relief means the elevations and depressions of the land surface. These features help describe the physical character of the mapped area.
Human-made features include settlements, cultivated land and transportation networks. Settlements are places where people live; cultivated land is land used for growing crops; transportation networks include connected routes such as roads and railways. Together, these details show how people use the area.
The Survey of India is the government organisation that prepares topographical maps of India. These maps use conventional signs, symbols and colours. A conventional sign or symbol is an agreed mark used to represent a particular feature on a map.
How do the parts of a map work together?
A legend, or key, explains the symbols and colours. Direction helps locate one feature in relation to another. Scale connects a measured map length with a ground distance. Reading a sheet means using these elements together.
Definition: A topographical sheet is a detailed map showing natural and human-made surface features, using a scale, conventional symbols and colours.
Begin by identifying what is represented. Then establish where the features lie and how far apart they are. Recognising a river symbol answers a different question from measuring the river's length, so both interpretation and measurement are needed.
What do the colours on topographical sheets mean?
Colours help separate different kinds of geographical features. A blue water feature can be distinguished from green forest cover without writing a full description across the map. Colour and symbol together allow many details to remain readable within a limited space.
Which colour associations should you learn?
| Colour | Feature represented | Meaning of the feature |
|---|---|---|
| Blue | Water body | A feature containing water, such as a river or lake. |
| Red | Settlements | Places where people live. |
| Yellow | Agriculture | Land used for growing crops. |
| Brown | High relief | Raised features of the land surface. |
| Green | Forests | Areas of land covered with trees. |
These associations are a starting point for reading a sheet. The map key gives the meaning of the particular mark being used. A colour identifies a broad category, while the shape of the symbol can distinguish one feature within that category from another.
For example, identifying a feature as a water body does not yet tell you whether it is a river, well or tank. A tank is a reservoir for storing water. Read the symbol and any label before naming the particular water feature.
Why must colour and shape be read together?
Symbols for roads and settlements can both use red on a topographical sheet. Therefore, red does not mean that every red mark is a settlement. A route symbol and a group of settlement marks must be distinguished by their forms and their entries in the key.
Likewise, brown is associated with relief, but colour alone does not give a numerical height. If a question asks only for a colour association, identify the category. If it asks for a particular feature, use the additional information supplied on the sheet.
A useful reading routine is to name the colour, inspect the shape, consult the key and then write the feature's name. This turns colour recognition into feature identification, rather than a guess based on appearance.
How do conventional signs and symbols make maps readable?
A symbol stands for something larger or more complicated than the mark itself. Drawing every building in its actual form would crowd a map. Symbols allow roads, buildings, rivers and other features to be shown clearly in the available space.
Conventional symbols have agreed meanings. Different countries use different sets of symbols. For maps of India, the Survey of India has fixed a set that helps different users interpret the same features consistently.
Which letters and line patterns should you recognise?
| Map letters | Full meaning | Feature identified |
|---|---|---|
| PO | Post Office | A postal service location. |
| PTO | Post and Telegraph Office | An office identified by the combined service label. |
| PS | Police Station | A police service location. |
| RS | Railway Station | A station on a railway line. |
Metalled roads have a hard prepared surface; unmetalled roads lack that hard surface. In a commonly used symbol key, metalled roads appear as continuous parallel lines and unmetalled roads as broken parallel lines. Match the line pattern to the key before identifying the road.
A boundary marks a limit between areas. International, state and district boundaries have distinguishable line patterns. The presence and arrangement of dashes and dots matter, so a rough recollection that all boundaries are broken lines is insufficient.
What the figure shows
Selected map symbols
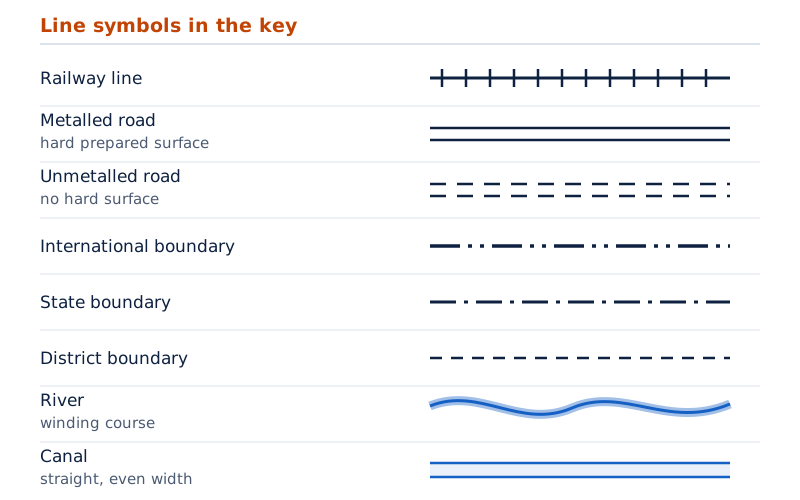
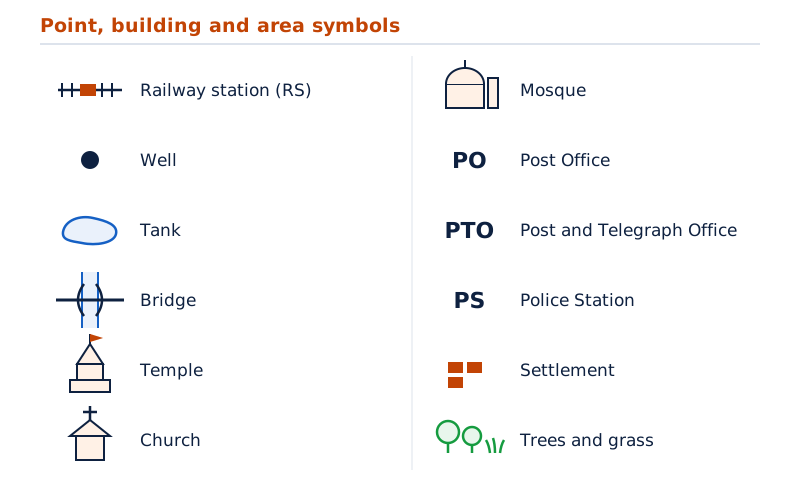
The key shows railway and road line patterns, boundary patterns, water features, religious buildings, letter symbols for offices, red settlement marks, and green trees and grass.
Drawn by One Young India.
How should you practise using a key?
Copy a symbol beside its meaning and compare it with nearby entries. Pay attention to whether lines are continuous or broken and whether the symbol contains letters. Practise reading in both directions: from a mark to its meaning and from a feature name to its symbol.
When describing a sheet, use the feature name rather than merely describing the ink. “Police station” explains what the letters represent; “two black letters” does not. Accurate identification depends on preserving the distinction between the mark and the real feature.
How do directions help you locate features?
Direction tells you where a feature lies in relation to a reference point. The four main, or cardinal directions, are north, east, south and west. Their abbreviations are N for north, E for east, S for south and W for west.
Most maps have an arrow marked N that points north. Establish north from that arrow before describing other directions. In a diagram with north at the top, east is to the right, south is below and west is to the left.
What are the intermediate directions?
Intermediate directions lie between neighbouring cardinal directions. Northeast, abbreviated NE, lies between north and east. Southeast, SE, lies between south and east. Southwest, SW, lies between south and west. Northwest, NW, lies between north and west.
To describe the position of one place from another, begin at the named reference place. Then look towards the destination. The phrase “from the hospital” makes the hospital the starting point for the direction, rather than the top or centre of the page.
What the figure shows
An imaginary small city
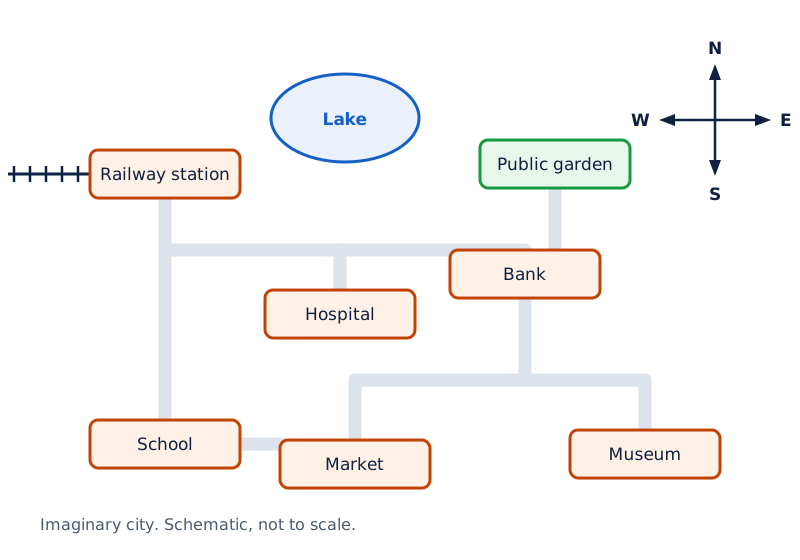
The map shows a railway station, school, hospital, market, bank, museum, lake and public garden linked by roads. Four arrows at the upper right are labelled N, E, S and W.
Drawn by One Young India.
What does direction tell you that distance does not?
A direction describes position relative to a reference point; a distance describes separation. Identifying a destination as east of a starting point does not state how far away it is. Measuring its distance does not by itself identify its direction.
On a map, locate both named features before interpreting their relationship. A correct symbol reading is necessary first: confusing a railway station with another service would also give you the wrong reference point for the direction.
Use a direction diagram for practice by writing the four cardinal directions and then inserting each intermediate direction between the appropriate pair. Keep north, the reference direction, clearly marked so that all the positions can be checked.
How does a representative fraction express scale?
Map distance is a length measured on the drawing. Ground distance is the corresponding length represented on the Earth's surface. Scale relates the two, so a short line can represent a much longer distance.
A representative fraction, abbreviated RF, expresses map distance compared with ground distance in the same units. In the notation 1 : 50,000, the colon means “to”. Thus, one unit on the map represents 50,000 of the same units on the ground.
Why must the units match?
In this fraction, the numerator is the map-distance number, 1, and the denominator is the ground-distance number, 50,000. Because the units match, the ratio can be used with different units of length. Do not read one side in centimetres and the other in kilometres.
The length units used here are the kilometre, abbreviated km; metre, m; centimetre, cm; and millimetre, mm. Their relationships let you express the ground distance in a convenient unit after applying the scale.
| Unit | Equivalent length |
|---|---|
| 1 kilometre | 1000 metres |
| 1 metre | 100 centimetres |
| 1 centimetre | 10 millimetres |
How can you read the fraction in words?
A statement of scale writes the relationship in words, such as “1 cm represents 360 metres”. For RF 1 : 36,000, one centimetre represents 36,000 centimetres. Dividing that ground length by 100 gives 360 metres.
| Representative fraction | Same-unit reading |
|---|---|
| 1 : 24,000 | 1 cm represents 24,000 cm. |
| 1 : 36,000 | 1 cm represents 36,000 cm. |
| 1 : 50,000 | 1 cm represents 50,000 cm. |
For the last scale, 50,000 centimetres are 500 metres. The procedure is the same: establish the equal units first and convert afterwards. The number following the colon represents ground units for each single map unit, not a distance with an unstated unit.
Note: RF gives a ratio using the same unit on both sides. A statement of scale names the units explicitly, so its map and ground lengths may use different units.
How do you read a linear scale?
A linear scale, also called a graphical scale or bar scale, is a line divided into marked lengths. Its labels give corresponding ground distances. A measured map length can be compared with this line to find the distance represented.
What do the main divisions and subdivisions show?
Primary divisions are the main equal sections of the scale bar. Secondary divisions are smaller subdivisions that allow shorter distances to be read. Check both the unit and the zero mark before using either set of divisions.
What the figure shows
A graphical scale
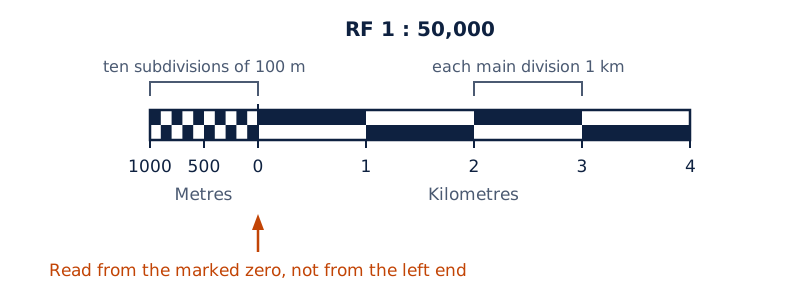
The bar is headed RF 1 : 50,000. To the right of zero, the main labels run from 1 to 4 kilometres. The subdivided part to the left is labelled in metres, including 500 and 1000.
Drawn by One Young India.
On this scale, the left end of the whole bar is not zero. The part left of zero supplies smaller readings in metres. Read from the marked zero and use the labels, rather than treating the full length of the printed bar as an unlabelled ruler.
How can a scale bar be constructed?
For RF 1 : 50,000, a line of 10 cm represents 5 km. Divide the line into five equal main parts. Assign 1 km to each part, place zero after the leftmost part, and label the four divisions to its right.
Dividing the leftmost part into ten equal subdivisions makes each subdivision represent 100 metres. This provides a way to read smaller distances alongside the main kilometre divisions. The relationship remains tied to the given RF and the length of the drawn bar.
A graphical scale remains valid when the map and its scale bar are enlarged or reduced together by the same proportion. Both change size together. A written statement of scale does not change its wording when the map image changes size.
Therefore, recognise whether you are using an RF, a written statement or a bar. They express a relationship between map and ground, but you read them differently. With a bar scale, its labelled divisions provide the direct comparison.
Case study: How does the scale on a map of India represent distance?
A physical map of the Indian Subcontinent has a scale bar labelled 0, 200 and 400 km. Each labelled interval represents 200 km on the ground, and the whole bar represents 400 km.
Compare a measured map distance with the printed bar to find the ground distance. Two labelled intervals represent 400 km; one labelled interval represents 200 km.
A distance exercise uses this scale to measure between the estuary of the Narmada River and the estuary of the Ganga River. An estuary is the place where a river meets the sea. Locate these endpoints, measure their separation on the map and convert using its scale.
How do you measure a straight distance on a map?
A straight-line distance is measured directly between two selected points. It can be measured with a ruler or with dividers, a drawing instrument whose two pointed arms can be set at the endpoints of a length.
First decide which two points the question identifies. The measurement must begin and end at those points. Then use the map's own scale to convert the measured length into the corresponding ground distance.
What sequence should you follow?
- Locate the two specified points and identify the scale supplied with the map.
- Place the ruler's zero at the starting point and read the length at the endpoint, or set dividers to span the distance.
- Record the map length with its unit, keeping it separate from the ground distance.
- Use the representative fraction, statement or linear scale to obtain the corresponding ground distance.
- Express the result with its ground unit and check that it answers the distance actually requested.
How does the scale work in a drawing activity?
Consider a rectangular school playground with a length of 40 m and a width of 30 m. A rectangle has four right angles. Use a scale of 1 cm representing 10 m to draw its outline.
The drawing length is 40 divided by 10, giving 4 cm. Its width is 30 divided by 10, giving 3 cm. Each dimension uses the same scale, so the relationship between the two sides is preserved.
Diagram
A school playground
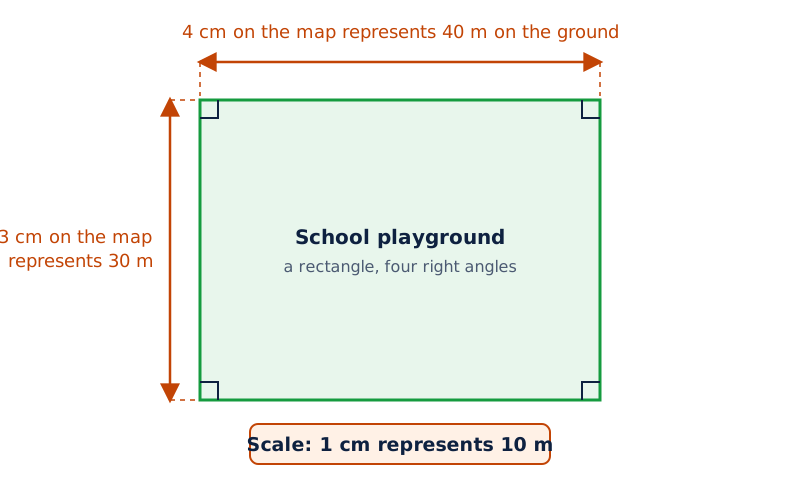
Draw a rectangle 4 cm long and 3 cm wide to represent a playground 40 m long and 30 m wide. Write the scale as 1 cm represents 10 m, and label both ground dimensions.
Drawn by One Young India.
This activity works from ground lengths to map lengths. Reading the completed drawing reverses the process: each centimetre stands for 10 metres. Drawing and measuring use the same relationship in opposite directions.
Do not confuse the shortest direct separation with the length of a winding route between the points. A straight ruler measures the direct line. Following a road or river requires measuring along its actual mapped course.
How do you measure a curved distance using thread?
A curved distance follows a bending line on the map. Rivers, streams and coastlines may follow irregular paths. Measuring a single straight line between the endpoints would miss the bends, so it would not measure the full course shown.
A thread can follow the route's shape. Once that section of thread is laid straight, its length can be measured and converted using the scale. The thread method therefore separates tracing the curve from reading its length.
What are the steps in the thread method?
- Identify the starting point, endpoint and the particular river or other curved route to be measured.
- Place one end of the thread at the starting point and carry it carefully along the mapped line.
- Continue around the bends until the endpoint, keeping track of the section of thread used.
- Lay that section of thread straight and measure its length with a ruler.
- Convert the measured map length into ground distance with the map's scale and state the unit.
What can make the measurement inaccurate?
Taking shortcuts across bends leaves out part of the route. Leaving loose loops adds length that does not belong to the mapped line. Keep the thread following the feature as closely as possible, especially where the course changes direction.
When straightening the thread, avoid pulling it so hard that its length changes. The purpose is to measure the section that followed the map, not to lengthen it. Using a ruler to read the straightened section does not remove errors made while tracing.
The scale conversion is the same as for a straight distance. What changes is how you obtain the map length: a ruler can measure a straight segment directly, while a thread first follows an irregular segment.
Record the two stages separately in a solution. State that the thread follows the curved route, then explain that its measured length is converted using the scale. This makes clear that you are measuring the course rather than merely the gap between endpoints.
How can you combine colours, symbols, direction and scale?
Map interpretation means turning the marks on a map into information about the represented area. No single element supplies every answer. Colours classify features, symbols identify them, directions describe relative positions and scale makes distances measurable.
What is a reliable reading routine?
- Read the map title to identify the area or subject represented.
- Locate the north arrow or direction indicator and identify north.
- Read the legend and identify the relevant colours, symbols and letter abbreviations.
- Locate the scale and note how it expresses the relationship between map and ground distances.
- Identify the requested features, then apply the appropriate direction or distance method.
Orientation means the way directions are arranged on the map. Establishing it before describing positions helps avoid confusing page position with geographical direction. Reading the legend first also prevents a wrong feature identification from affecting later measurements.
How do you match the method to the question?
| Information wanted | Map element or method | What to report |
|---|---|---|
| Kind of feature | Colour, symbol and legend | The identified geographical feature. |
| Relative position | Direction indicator and reference point | The direction of one feature from another. |
| Direct separation | Ruler or dividers and scale | Straight ground distance with a unit. |
| Length along a curve | Thread, ruler and scale | Ground distance following the mapped course. |
Practise by identifying roads, settlements and water bodies on a sheet. Explain which marks led to each identification. Then choose a pair of labelled features for a direction exercise or a clearly specified line for measurement.
For a drawing activity, use a map of your locality or school surroundings. Include the features actually observed, show directions and give a key for the conventional symbols used. Where distances are measured and drawn to scale, state that scale clearly.
Finally, check that the answer addresses the request. A colour name does not replace a feature name, a direction does not replace a distance, and a map length does not replace a converted ground length. Clear labels and units make the interpretation understandable.
Case study: How can you read the Ganga area on sheet 63K/12?
A topographical extract from sheet 63K/12 covers part of the Mirzapur and Varanasi districts in Uttar Pradesh. Its RF is 1 : 50,000. The reading exercise includes the river Ganga, Bhatauli village, settlements, post offices and the meaning of yellow colouring.
First convert the RF into a statement of scale. One centimetre on the sheet represents 50,000 cm on the ground. Since 100 cm equals 1 m, m. Thus, 1 cm represents 500 m.
Next use the colours and conventional symbols to identify features. Yellow represents agricultural land, while PO identifies a post office. Read the settlement names beside their marks to distinguish the places from the services located within them.
For direction practice, locate the Ganga and establish north before examining its direction of flow. For Bhatauli, identify its position beside the river and investigate the means of crossing shown. The scale calculation supplies a distance relationship; the symbols and directions answer different questions.
Glossary
- Topographical sheet — A detailed map showing natural and human-made surface features through scale, colours and conventional symbols.
- Relief — The elevations and depressions that give the land surface its varied physical form.
- Settlement — A place where people live, represented on a map by an appropriate mark or group of marks.
- Conventional symbol — An agreed mark representing a particular feature, allowing different users to interpret a map consistently.
- Legend — The key explaining the meanings of symbols and colours used on a map.
- Cardinal directions — The four main directions, north, east, south and west, used to describe relative positions.
- Intermediate directions — Directions between neighbouring cardinal points: northeast, southeast, southwest and northwest.
- Map scale — The relationship between a distance on a map and the corresponding distance on the ground.
- Representative fraction — A scale expressed as a ratio of map distance to ground distance measured in the same units.
- Linear scale — A divided line whose labelled lengths show ground distances corresponding to distances on the map.
- Map distance — A length measured on the drawing before conversion into the corresponding ground distance.
- Ground distance — The actual distance represented by a measured map length, obtained by using the map's scale.
- Dividers — A drawing instrument with two pointed arms used to span and transfer a measured length.
- Thread method — Measuring a curved map line by following it with thread, then measuring the straightened section.
Common errors and misconceptions
- Misconception: Every red mark identifies a settlement. Correct: Red can also appear in road symbols. Use the symbol's form and the legend to identify the particular feature.
- Misconception: RF 1 : 50,000 means 1 cm represents 50,000 km. Correct: Both sides use the same unit, so 1 cm represents 50,000 cm.
- Misconception: A map length is already the required ground distance. Correct: Convert it with the map's scale, then state the resulting ground unit.
- Misconception: The left end of every linear scale is zero. Correct: Find the marked zero; a subdivided portion may extend to its left.
- Misconception: A river's length is the straight gap between its endpoints. Correct: Follow its bends with thread before measuring and applying the scale.
- Misconception: A direction can be stated without a reference place. Correct: Identify the starting feature and describe the other feature's position from it.
- Misconception: All maps use identical symbols. Correct: Different countries use different sets. Read the key supplied with the particular map.
Exam-style questions with model answers
Q1. Define a representative fraction and explain what RF 1 : 24,000 means when centimetres are used. [2 marks]
- A representative fraction expresses the ratio of map distance to corresponding ground distance in the same units.
- RF 1 : 24,000 means that 1 centimetre on the map represents 24,000 centimetres on the ground.
Q2. A map has RF 1 : 36,000. Explain its same-unit meaning, convert the ground distance represented by 1 cm into metres using 100 cm = 1 m, and write the statement of scale. [3 marks]
- The fraction means that one unit on the map represents 36,000 of the same units on the ground. Thus, 1 cm represents 36,000 cm.
- Convert the ground length into metres: 36,000 divided by 100 gives 360 m, using the supplied conversion.
- The statement of scale is therefore: 1 cm on the map represents 360 m on the ground.
Q3. A rectangular playground is 40 m long and 30 m wide. Using 1 cm to represent 10 m, calculate both drawing dimensions, state the scale to write, and explain why both dimensions need the same scale. [4 marks]
- The drawing length is 40 divided by 10, which gives 4 cm for the playground's longer side.
- The drawing width is 30 divided by 10, which gives 3 cm for the shorter side.
- Write the scale beside the drawing as “1 cm represents 10 m”. Label the ground dimensions separately.
- Both dimensions need the same scale so that the relationship between the playground's length and width is preserved.
Q4. A river follows a curved course between two marked endpoints. Its map has a labelled linear scale. You have thread and a ruler. Explain five steps for finding the ground distance along the river. No numerical distance is required. [5 marks]
- Locate the two marked endpoints and identify the river's course between them. Check the labelled linear scale that will be used for conversion.
- Place the end of the thread at the starting point. Guide it along the river's mapped course, following the bends carefully.
- Continue to the endpoint and identify the section of thread used. Avoid cutting across bends or leaving extra loops beside the line.
- Lay the used section straight without pulling it longer. Measure this length with the ruler to obtain the map distance.
- Compare that length with the linear scale to find the ground distance along the river. Report the distance with the scale's ground unit.
Q5. A map key assigns blue to water bodies, red to settlements, yellow to agriculture, brown to high relief and green to forests. Give five interpretations, one for each category, using colour together with the key. [5 marks]
- Blue identifies the water-body category. Read the accompanying symbol to decide which water feature is represented, rather than assuming that every blue feature is a river.
- Red settlement marks identify places where people live. Match their shapes to the settlement entry, since the key supplies the intended meaning.
- Yellow identifies agricultural land in this key. It distinguishes land used for growing crops from the forest category shown in green.
- Brown identifies high relief, meaning raised features of the land surface. The colour association alone does not supply a numerical height.
- Green identifies forests in this key. Read the coloured area with the legend to identify tree-covered land, rather than naming it from colour alone.
Q6. A north-up direction diagram places the museum southeast of the bank and the railway station northwest of the hospital. State both directions with their reference places, then distinguish direction from distance. [3 marks]
- Starting at the bank, the museum lies to the southeast. The bank is the reference place for this description.
- Starting at the hospital, the railway station lies to the northwest. The hospital is the reference place in this case.
- Direction describes relative position; distance describes separation. These directional statements do not provide a numerical distance between either pair of places.
Q7. A symbol key gives PO = Post Office, PS = Police Station, RS = Railway Station, and continuous parallel lines = metalled road. Decode the four marks and state what each identifies. [4 marks]
- PO means Post Office. It identifies a postal service location on the map using the letters given in the key.
- PS means Police Station. It identifies a police service location, which must be distinguished from the post office.
- RS means Railway Station. It identifies a station associated with the railway, rather than a road feature.
- Continuous parallel lines identify a metalled road in this key. This is a road with a hard prepared surface.
Q8. A graphical scale for RF 1 : 50,000 uses a 10 cm line to represent 5 km. It has five equal main parts, zero after the leftmost part, and ten equal subdivisions within that leftmost part. Using 1 km = 1000 m, explain its main division value, right-side labels, subdivision value, zero position and behaviour when enlarged with the map. [5 marks]
- The five equal main parts represent a total of 5 km. Each main part therefore represents 1 km on the ground.
- Four main parts lie to the right of zero. Their successive endpoint labels are 1, 2, 3 and 4 km.
- The leftmost 1 km part contains ten equal subdivisions. Since 1 km equals 1000 m, each subdivision represents 100 m.
- Zero is after the leftmost part, not at the left end of the whole bar. The left section provides the smaller divisions.
- The graphical scale remains valid when enlarged together with the map by the same proportion. The map distances and the bar's drawn lengths change together.
Key takeaways
- Topographical sheets show natural and human-made features in detail, using a scale, conventional symbols and colours.
- Learn blue for water, red for settlements, yellow for agriculture, brown for high relief and green for forests.
- Use colour together with symbol shape and the legend; a broad colour association does not identify every particular feature.
- A representative fraction compares map and ground distances in the same units, allowing the relationship to be used consistently.
- A linear scale has labelled divisions; locate its zero and read the units before measuring against it.
- Measure direct distances with a ruler or dividers, then use the map's scale to obtain ground distances.
- Measure curved routes by following their bends with thread, measuring the straightened length and applying the scale.
- State direction from a named reference point, and distinguish this description of position from a measurement of distance.
Test yourself
What is the purpose of a map legend?
It explains the symbols and colours, helping the reader identify the features represented on the map.
What does RF 1 : 50,000 mean in centimetres?
One centimetre on the map represents 50,000 centimetres on the ground, with the same unit used on both sides.
Why should you not identify every red mark as a settlement?
Red can also be used in road symbols. Read the mark's shape and compare it with the legend.
How do cardinal and intermediate directions differ?
Cardinal directions are north, east, south and west. Intermediate directions lie between neighbouring cardinal directions: northeast, southeast, southwest and northwest.
Why is a ruler alone insufficient for tracing a winding river?
A straight ruler does not follow the river's bends. Trace the course with thread, then measure that section and apply the scale.
What should you locate before reading a linear scale?
Locate the marked zero and the distance units, then distinguish the main divisions from the smaller subdivisions.
What happens to a graphical scale when enlarged proportionally with its map?
It remains valid because the map and the scale bar change size together by the same proportion.
Why must a direction answer name its reference place?
The reference place identifies the point from which the other feature's position is being described.
Write about it
Turn a question from this chapter into a paper.
The Writing Studio has a structure guide, a rubric and citation tools for 15 formats, from essays to research papers. Drafting is free with an account. Learnacy Essential adds feedback from an AI writing coach and submission to The OYI Review.
Learnacy Essential is ₹1,499 for the year. Publication depends on review and is not guaranteed.