
Sectors of the Indian Economy | CBSE Class 10 Economics Notes
On this page
Watch & explore
Start with a few high-quality watches, then dive into the notes below.
Try an idea before you read. The same product passes through all three sectors. Sort each activity. Explore →

Learnacy Labs Try it hands-on: open the Economic Activity & Resources lab
This note covers primary, secondary and tertiary activities, sectoral interdependence, production and employment, final goods, gross domestic product, gross value added, underemployment, employment creation, organised and unorganised work, worker protection, and public and private sectors.
What distinguishes the primary, secondary and tertiary sectors?
Economic activities produce goods or provide services. They can be grouped into sectors according to the nature of the work. This classification helps us understand what people produce, how production happens and how different activities contribute to the economy.
Primary activities and natural resources
The primary sector produces goods through the use of natural resources. Cotton cultivation depends mainly, though not entirely, on rainfall, sunshine and climate. Dairy production depends on animals' biological processes and the availability of fodder. Minerals and ores are also natural products.
Agriculture, dairy, fishing and forestry supply many of these products. The primary sector is therefore also called the agriculture and related sector. It forms the base for products that are subsequently made through manufacturing.
Manufacturing and services
The secondary sector changes natural products into other forms through manufacturing. Cotton becomes yarn and cloth; sugarcane becomes sugar or gur; earth becomes bricks used in construction. Manufacturing can take place in a factory, a workshop or a home. This is also the industrial sector.
The tertiary sector provides services. Transport, storage, communication, banking and trade support production and distribution. Teachers, doctors, barbers, lawyers and people doing administrative or accounting work also provide services, including services that do not directly help to manufacture goods.
| Sector | Basis of activity | Examples |
|---|---|---|
| Primary | Obtaining natural products | Cotton cultivation, dairy and fishing |
| Secondary | Transforming natural products | Weaving cloth, making sugar and making bricks |
| Tertiary | Providing services | Banking, transport, teaching and medical care |
Information technology has also created important services, including call centres and software services. The distinction concerns the nature of activity, rather than whether the activity is traditional or modern. A service remains economically important even when it does not produce a physical good.
How do the three sectors depend on one another?
The three sectors are interdependent. Manufacturing requires raw materials, agriculture uses manufactured inputs, and both depend on services. Dividing activities into separate categories helps analysis, but does not mean that each sector operates independently.
Raw materials, inputs and markets
A sugar mill depends on farmers for sugarcane. If farmers refuse to supply a particular mill, that mill will have to close. This shows the dependence of the secondary sector on the primary sector for materials used in production.
Dependence also runs in the other direction. If companies import all their cotton instead of buying it in India, demand for Indian cotton falls. Cotton prices and cultivation profits fall, and farmers may face bankruptcy if they cannot quickly change to other crops.
Farmers purchase tractors, pumpsets, electricity, pesticides and fertilisers. A rise in the price of fertilisers or pumpsets raises cultivation costs and reduces profits. Agricultural production therefore depends on the availability and cost of industrial goods and related services.
Transport connects producers and consumers
If transporters stop carrying vegetables and milk from rural areas, urban consumers face shortages while farmers cannot sell their produce. Food exists, but the interruption in transport services prevents it from reaching buyers. Production and distribution must work together.
| Situation | Dependence demonstrated | Possible result |
|---|---|---|
| Sugarcane supply stops | Industry depends on agriculture | The affected mill closes |
| Companies stop buying Indian cotton | Agriculture depends on industrial demand | Cotton prices and farmers' profits fall |
| Fertiliser prices rise | Agriculture depends on manufactured inputs | Cultivation becomes more costly |
| Transport of food stops | Producers and consumers depend on services | Urban shortages and unsold rural produce |
These relationships explain why improvement in one sector can support others. They also explain why a disruption may spread across sectors. A classification identifies the kind of work; interdependence explains how the work connects with the wider economy.
How are production and gross domestic product measured?
Cars, coconuts and wheat cannot meaningfully be added as physical quantities. Their monetary values provide a common basis for comparison. For a good sold at a given price, multiply the quantity sold by the price of each unit.
Value = quantity × price per unit
Here, value means the monetary amount, quantity means the number of units, and price per unit means the money paid for one unit. The sign × means multiplication. The symbol ₹ denotes Indian rupees, and kg means kilogram.
Worked example 1. A quantity of 10,000 kg of wheat sells at ₹20 per kg. What is its value?
Answer: 10,000 × ₹20 = ₹2,00,000. The quantity is measured in kilograms, so the matching price is the price per kilogram.
Worked example 2. A quantity of 5,000 coconuts sells at ₹15 per coconut. Find the total value.
Answer: 5,000 × ₹15 = ₹75,000. Using monetary values makes different products comparable without adding unlike physical units.
Final goods and double counting
Final goods reach consumers. Intermediate goods are used up in producing final goods and services. The value of a final good already includes the value of the intermediate goods used in making it. Counting both would count some production more than once.
Worked example 3. A farmer sells wheat to a mill for ₹20 per kg. The mill sells flour to a biscuit company for ₹25 per kg. The company uses flour, sugar and oil to make four packets sold to consumers at ₹20 each. What final value is counted?
Answer: Four packets × ₹20 = ₹80. Count the ₹80 final biscuit value. The flour and wheat are intermediate goods in this production chain, so their values must not be added separately to ₹80.
GDP and the accounting period
Definition: Gross Domestic Product, abbreviated GDP, is the value of all final goods and services produced within a country during a particular year.
The value of final goods and services produced in each sector during that year gives the sector's production. Adding production across sectors gives GDP. The calculation concerns production within the country, uses a particular year and avoids double counting intermediate goods.
- Identify the goods and services produced within the country during the year.
- Use their monetary values so unlike products can be compared.
- Include final goods and services without separately recounting their intermediate inputs.
- Add the production values across sectors to obtain the total.
In India, a central government ministry estimates GDP with information from departments in states and union territories. Information about quantities and prices is needed. GDP indicates the size of the economy; it does not itself tell us how many people have secure jobs.
How have sectors changed over time, and how should GVA be compared?
In many now developed countries, the primary sector was initially the most important source of production and employment. Improvements in farming increased food production. More people could become craft workers, traders, transporters and administrators, although agriculture remained dominant at that stage.
From farming to industry and services
Over a long period, new manufacturing methods and expanding factories brought a shift towards the secondary sector. Many people moved from farms to factories. Later, the tertiary sector became the largest source of production and employment in developed countries.
This historical pattern provides a basis for asking whether changes in India's production have been accompanied by similar changes in employment. The two changes must be examined separately. A growing share of output does not automatically establish that a sector employs most workers.
Gross Value Added, abbreviated GVA, is used to present sectoral contributions after adjustments relating to taxes and subsidies. Keep GDP and GVA labels distinct when reading data. A graph labelled GVA should be described as a GVA graph.
What the figure shows
GVA by sector
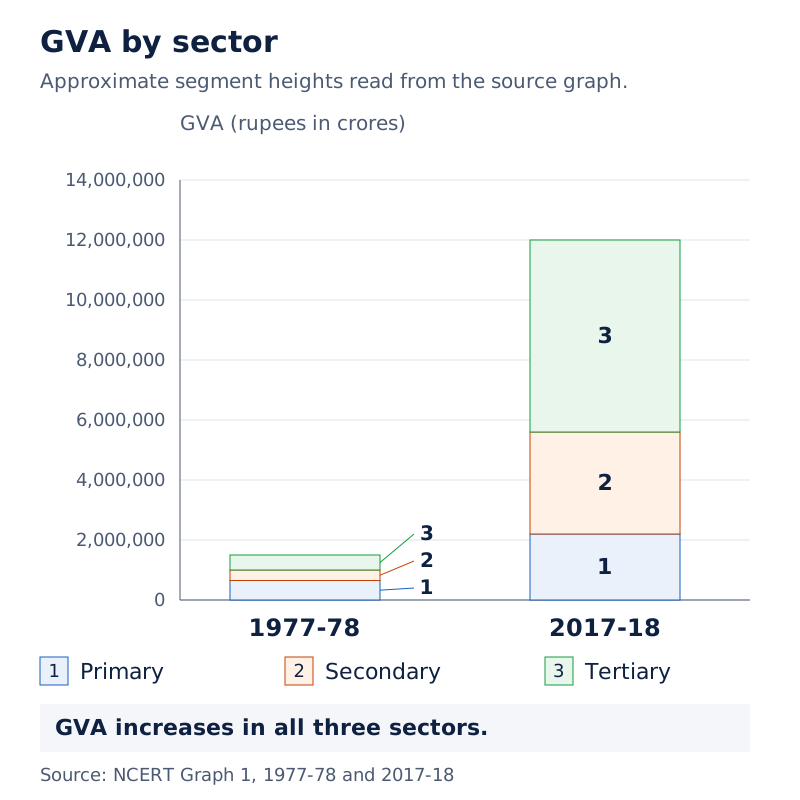
Two stacked columns compare 1977-78 and 2017-18. The vertical axis measures rupees in crores. Blue represents primary, red secondary and green tertiary production. The later column is much taller, with the tertiary segment largest.
Drawn by One Young India. Reference: NCERT Class 10 Graph 1
Calculating shares from sector totals
For a table listing the three sectors, add their GVA values to obtain total GVA. A sector's percentage share compares its own GVA with this total. The symbol ÷ means division, and % means per cent, or out of one hundred.
Total GVA = primary GVA + secondary GVA + tertiary GVA
Sector share = sector GVA ÷ total GVA × 100%
Worked example 4. In 2001-02, primary, secondary and tertiary GVA were ₹13,23,000 crore, ₹10,40,000 crore and ₹19,31,000 crore. Calculate total GVA and the primary share.
Answer: Total GVA = ₹42,94,000 crore. Primary share = 13,23,000 ÷ 42,94,000 × 100%, approximately 30.81%. The same method gives secondary and tertiary shares of approximately 24.22% and 44.97%.
These percentages are calculated from the stated table values. They describe 2001-02, not the present year. Always keep the date and the measure attached to a numerical comparison.
Why has the tertiary sector become more important in India?
Between 1977-78 and 2017-18, production increased in all three sectors, but it increased most in the tertiary sector. By 2017-18, the tertiary sector was the largest producing sector. Several connected developments explain its growing importance.
Four sources of increased demand
- Basic services: Hospitals, schools, police stations, courts, village administration, transport, banks and insurance are needed in a country. In a developing country, government must take responsibility for providing basic services.
- Growth of other sectors: Agricultural and industrial expansion increases the demand for transport, storage and trade. More production requires more services to connect inputs, producers and buyers.
- Higher incomes: Some people demand more tourism, eating out, shopping, private healthcare, private education and professional training as their incomes rise.
- New technology: Services based on information and communication technology have become important, and their production has expanded rapidly.
What the figure shows
Sectoral shares of GVA
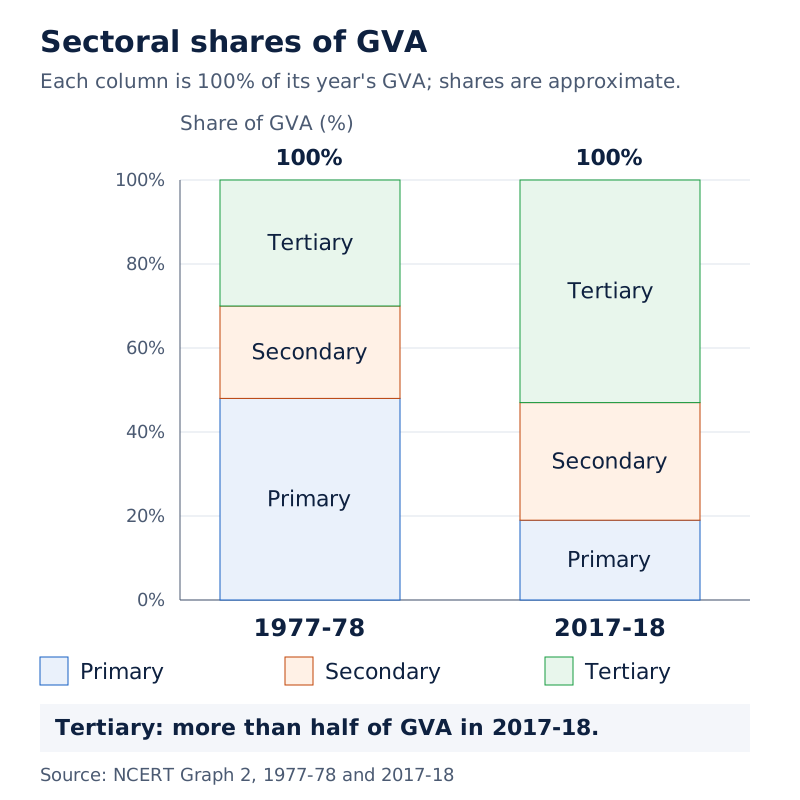
Two stacked percentage columns compare 1977-78 with 2017-18. Each reaches 100 on the vertical scale. The blue primary segment becomes smaller, while the green tertiary segment becomes larger and occupies more than half of the later column.
Drawn by One Young India. Reference: NCERT Class 10 Graph 2
Why growth does not benefit every service worker equally
The service sector includes very different kinds of work. Some services employ highly educated and skilled workers. Others include small shopkeepers, repair workers and transport workers who barely earn a living and continue because better opportunities are unavailable.
Consequently, it is incorrect to describe every service activity as rapidly growing or every service job as well paid. Expansion in total service production can coexist with low earnings and inadequate work for many individuals in the same broad sector.
The sector's rising importance also does not make agriculture and industry unnecessary. Much service demand comes from those sectors. Transporting crops, storing goods and financing production illustrate how the growth of services remains connected to the production of physical goods.
Why must employment be studied separately from output?
A sector's output share shows its contribution to production. Its employment share shows the proportion of workers employed there. These answer different questions. India's shift towards services in production has not been matched by an equally large movement of workers out of agriculture.
Reading the employment comparison
| Sector | Employment share in 1977-78 | Employment share in 2017-18 |
|---|---|---|
| Primary | 71% | 44% |
| Secondary | 11% | 25% |
| Tertiary | 18% | 31% |
What the figure shows
Sectoral employment shares
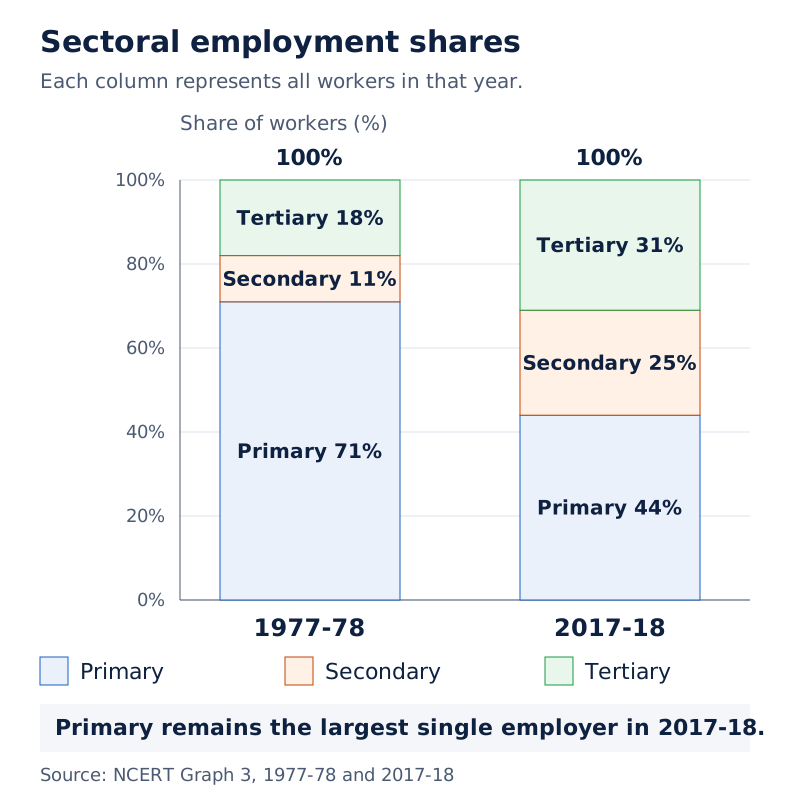
Two stacked columns show percentages for 1977-78 and 2017-18. Primary employment is labelled 71 and 44, secondary 11 and 25, and tertiary 18 and 31. The primary sector remains the largest single employer in the later column.
Drawn by One Young India. Reference: NCERT Class 10 Graph 3
The primary share declined, while the secondary and tertiary shares increased. However, 44% remained larger than either 25% or 31%. Being the largest single sector does not mean employing more than half of all workers.
Production can grow faster than jobs
Over the forty-year comparison, industrial output rose by more than nine times while industrial employment rose by around three times. Service production rose by fourteen times while employment rose by around five times. These contrasts show that production and employment did not expand at the same rate.
Too few jobs were created in industry and services to absorb all the people seeking better work. Many workers therefore remained in agriculture even when all their labour was not required. This connects sectoral change with the problem of underemployment.
Employment information has been collected through surveys by the National Sample Survey Organisation, abbreviated NSSO, now known as the National Statistical Office, abbreviated NSO. Comparing employment evidence with production evidence helps identify where workers need more productive opportunities.
The practical question is therefore wider than identifying the largest producing sector. We must also consider where people work, whether they can use their abilities fully and whether new production creates adequate employment.
What is disguised unemployment, and how does Laxmi's case explain it?
Definition: Underemployment occurs when people work less than they are capable of working. When people appear employed but some could leave without reducing output, the hidden unemployment is called disguised unemployment.
Laxmi's family farm
Laxmi owns about two hectares of unirrigated land and grows crops such as jowar and arhar. Her land depends on rainfall. All five members of her family work on it throughout the year because they have no other work available.
Everyone appears busy, but the available work is divided among more people than necessary. Each person works below their potential. Counting all five as working does not reveal how much productive employment the small farm actually provides.
Suppose Sukhram, a landlord, hires one or two family members to work on his land. The remaining family members can maintain production on Laxmi's plot. The family gains wage income without losing its previous farm output.
The same reasoning applies if two members obtain factory work. Their new earnings increase family income while production on the original plot continues. The crucial condition is that the people who leave were not needed to maintain that plot's existing output.
Visible unemployment and hidden underemployment
Open unemployment occurs when a person is able and willing to work at the prevailing wage but cannot find a job. Disguised unemployment is harder to identify because people seem to be working. It does not mean that they are lazy or unwilling to work; they lack enough productive opportunities.
| Situation | What can be observed? | Main problem |
|---|---|---|
| Open unemployment | A person is able and willing to work but has no job | The person cannot find employment at the prevailing wage |
| Disguised unemployment on a farm | People work, but some can leave without reducing output | Too many workers share limited work |
| Urban underemployment | Casual workers do not find work every day | Available work does not use their full capacity |
Urban painters, plumbers and repair workers may search for daily work without finding it regularly. Street sellers may spend long hours earning very little because they have no better opportunities. Underemployment is therefore not confined to agriculture or rural areas.
How can more employment be created in rural and urban areas?
Employment can grow through improvements in farming, industries near villages, transport and storage, and services such as education and healthcare. The most useful measures connect the need for productive work with facilities that improve people's lives.
Irrigation, credit and local processing
A government-funded well or a bank loan for a well could allow Laxmi to irrigate her land and grow wheat as a second crop in the rabi season. The illustration assumes that one hectare of wheat provides work for two people for fifty days.
Canals and dams can extend irrigation to many farms. Farmers also need seeds, fertilisers, equipment and pumpsets. Affordable agricultural credit enables them to obtain these inputs in time without relying on expensive borrowing from moneylenders.
- Provide irrigation so farmers can cultivate more regularly and grow an additional crop.
- Make reasonably priced credit available for seeds, fertilisers and necessary equipment.
- Improve roads, transport and storage so farmers can reach markets and sell additional produce.
- Encourage processing industries and services near rural producers to create further employment.
A dal mill can process arhar and chickpea. Cold storage helps farmers store potatoes and onions until prices are favourable. Honey collection centres near forests and processing of agricultural produce can create work in semi-rural areas rather than requiring all jobs to be in large cities.
Education, health and other services
More schools require buildings, teachers and other staff. Better rural healthcare requires doctors, nurses and health workers. An estimate by the erstwhile Planning Commission, now known as NITI Aayog, identified the possibility of nearly twenty lakh additional jobs in education.
The same study estimated that improving tourism could provide additional employment to more than thirty-five lakh people each year. These are estimates of potential, not counts of jobs already created. Regional crafts, tourism and information technology services need planning and support suited to the area.
Employment guarantees and the Right to Work
The Mahatma Gandhi National Rural Employment Guarantee Act 2005, abbreviated MGNREGA 2005, was a measure implementing the Right to Work in about 625 districts. It guaranteed one hundred days of employment in a year to those able to work and needing work in rural areas.
If government failed to provide employment, unemployment allowances were payable. Work that could improve future production from land received preference. The guarantee addressed an immediate need for work while longer-term employment measures were being developed.
In 2025, MGNREGA was replaced by Viksit Bharat-Guarantee for Rozgar and Ajeevika Mission, abbreviated Viksit Bharat-G RAM G 2025. The one-hundred-day provision above describes MGNREGA 2005; it should not be transferred automatically to the replacement framework.
How do organised and unorganised employment conditions differ?
The division into organised and unorganised sectors concerns employment conditions. Organised enterprises are registered with government, follow formal procedures and are expected to follow employment rules. Employment terms are regular, and workers have assured work.
Kanta and Kamal
Kanta works in an office from 9.30 a.m. to 5.30 p.m. She receives a regular monthly salary, provident fund, medical and other allowances, and a paid Sunday holiday. Her appointment letter sets out the terms and conditions of employment.
Kamal works as a daily wage labourer in a grocery shop from 7.30 a.m. to 8.00 p.m. He receives wages without other allowances. Days not worked are unpaid. He has no formal appointment letter and can be asked to leave at any time.
| Condition | Organised employment | Unorganised employment |
|---|---|---|
| Regularity | Regular terms and assured work | Work is often irregular |
| Hours | Fixed hours with overtime payment for additional work | Overtime benefits are generally absent |
| Leave | Paid leave and holidays | No assured paid leave or holidays |
| Security | Employment security | Workers may be dismissed without adequate security |
| Benefits | Benefits such as provident fund and gratuity | Such benefits are generally unavailable |
| Rules | Formal procedures and required compliance | Rules exist but are often not followed |
Formal rules and protection
The laws associated with organised employment include the Factories Act, Minimum Wages Act, Payment of Gratuity Act, and Shops and Establishments Act. Relevant protections include drinking water, a safe working environment and medical benefits. Organised workers also receive retirement benefits such as pensions.
The unorganised sector consists of small, scattered units largely outside effective government control. Some workers are self-employed, such as street sellers, repair workers and farmers. Being self-employed does not by itself settle the classification: some self-employed people register and follow formal rules.
Why do workers in the unorganised sector need protection?
Low and irregular earnings, insecure employment and lack of benefits leave many unorganised workers vulnerable. A person may have work without receiving a fair wage, safe conditions or reliable support during illness. Creating jobs and protecting workers are therefore connected but distinct tasks.
Rural and urban support needs
Rural workers needing protection include landless agricultural labourers, small and marginal farmers, sharecroppers and artisans. Weavers, blacksmiths, carpenters and goldsmiths are examples of artisans. Farmers need timely seeds and inputs, credit, storage and access to marketing outlets.
In towns and cities, vulnerable workers include those in small industries, construction, trade and transport. Street vendors, headload workers, garment makers and rag pickers also need support. Small industries need help obtaining raw materials and marketing their output.
The majority of workers from scheduled castes, tribes and backward communities work in the unorganised sector. These workers face social discrimination as well as low-paid and irregular work. Protecting them supports both economic and social development. The need is not limited to increasing production; it includes improving the circumstances in which people earn a living.
Interpreting a historical employment table
The following figures describe workers in the late 1990s, measured in millions. Completing the totals shows the scale of unorganised employment in that historical comparison. A million means ten lakh people.
| Sector | Organised workers, millions | Unorganised workers, millions | Total, millions |
|---|---|---|---|
| Primary | 1 | 231 | 232 |
| Secondary | 41 | 74 | 115 |
| Tertiary | 40 | 88 | 128 |
| Total | 82 | 393 | 475 |
Unorganised workers = total workers − organised workers
Here, the minus sign means subtraction, and all three quantities must use the same unit. For primary employment, 232 − 1 = 231 million. Across sectors, unorganised workers account for approximately 82.74% of 475 million workers; organised workers account for approximately 17.26%.
The need for protection is also linked to insecure transitions between jobs. Workers who lose regular employment may be forced into low-paid informal work. Employment opportunities in the organised sector must expand alongside protection and support for those already working elsewhere.
What distinguishes public ownership from private ownership?
The division into public and private sectors is based on who owns assets and who is responsible for delivering services. It asks a different question from the nature of production or the conditions under which workers are employed.
Ownership and purpose
In the public sector, government owns most assets and provides services. Railways and the post office are examples. In the private sector, individuals or companies own assets and provide services. Examples include Tata Iron and Steel Company Limited and Reliance Industries Limited.
Private activities are guided by the aim of earning profits. People pay private individuals or companies for their goods and services. Public activities have a wider purpose than profit alone. Governments raise money through taxes and other means to meet expenditure on services.
| Basis of classification | Categories | Question answered |
|---|---|---|
| Nature of activity | Primary, secondary, tertiary | What kind of production or service is involved? |
| Employment conditions | Organised, unorganised | How regular and protected is employment? |
| Ownership | Public, private | Who owns assets and provides services? |
Keeping the three classifications distinct
The classifications should not be treated as interchangeable. A description of ownership does not itself explain the nature of output. Likewise, identifying a service does not tell us whether its workers receive regular pay, paid leave and employment security.
When analysing an activity, first identify the criterion being used. If the concern is natural products and manufacturing, use the activity classification. If the concern is working hours and benefits, examine employment conditions. If the concern is who controls assets, examine ownership.
This distinction makes comparisons more precise. It helps explain why an economy may need both increased production and improved employment conditions, as well as public provision of services whose social value extends beyond the profits an enterprise can earn.
Why does the government provide and support economic activities?
Some services are needed by society as a whole but may not be supplied privately at a reasonable cost. Public expenditure helps provide infrastructure, supports essential production and meets responsibilities in education, health and human development.
Infrastructure and support for production
Roads, bridges, railways, harbours, electricity generation and irrigation dams can require very large spending. Collecting payment from every user is also difficult. Government undertakes such expenditure to make these facilities available more widely.
Charging industries the full generation cost of electricity may make production too expensive, especially for small units. Government can supply electricity at affordable rates and bear part of the cost. This supports production that might otherwise become unviable.
Government also buys wheat and rice from farmers at a fair price, stores them and sells them to consumers at lower prices through ration shops. By bearing part of the cost, it supports both farmers and consumers.
Human development and employment
Education and healthcare are major government responsibilities. Safe drinking water, housing for poor people, food and nutrition also require attention. The poorest and most neglected regions need increased public spending so that access to essential facilities improves.
The difference between output and employment can also be examined within a city. The following historical case shows why the number of workers and the income generated should both be considered when planning better opportunities.
Worked example 5. In Ahmedabad in 1997-98, there were 15,00,000 workers, including 11,00,000 in the unorganised sector. Total city income was ₹60,000 million, of which ₹32,000 million came from the organised sector. Find organised employment and unorganised income.
Answer: Organised employment = 15,00,000 − 11,00,000 = 4,00,000 workers. Unorganised income = ₹60,000 million − ₹32,000 million = ₹28,000 million. Each missing amount is found by subtracting the known part from the corresponding total.
| Sector in Ahmedabad, 1997-98 | Workers | Income in ₹ million |
|---|---|---|
| Organised | 4,00,000 | 32,000 |
| Unorganised | 11,00,000 | 28,000 |
| Total | 15,00,000 | 60,000 |
More productive jobs, support for small enterprises, expanded public services and protection for workers address different parts of the employment problem. Economic development requires attention to what is produced, who finds work and the conditions under which that work is performed.
Glossary
- Primary sector — Activities that obtain natural products by using resources such as land, water, forests and minerals.
- Secondary sector — Activities that transform natural products into other forms through manufacturing in factories, workshops or homes.
- Tertiary sector — Activities providing services, including production support, transport, education, healthcare and personal services.
- Interdependence — A relationship in which sectors rely on one another for inputs, services or demand.
- Final goods — Goods that reach consumers and whose value includes the intermediate goods used in their production.
- Intermediate goods — Goods used up in producing final goods and services, such as flour used to make biscuits.
- Gross Domestic Product — The value of all final goods and services produced within a country during a particular year.
- Gross Value Added — A measure used to present sectors' economic contributions after adjustments relating to taxes and subsidies.
- Underemployment — A situation in which people are working less than their capacity because sufficient productive opportunities are unavailable.
- Disguised unemployment — Hidden unemployment in which people appear employed but some can leave without reducing existing production.
- Organised sector — Registered enterprises or workplaces with regular employment terms and formal procedures governed by applicable rules.
- Unorganised sector — Small and scattered units where employment is often insecure and employment rules are generally not followed.
- Public sector — Economic activities in which government owns most assets and takes responsibility for providing services.
- Private sector — Economic activities in which individuals or companies own assets and take responsibility for delivering services.
Common errors and misconceptions
- Misconception: The three sectors work independently. Correct: Agriculture supplies industrial inputs, industry supplies farming equipment, and services support both.
- Misconception: Services do not contribute to production because they make no physical goods. Correct: Services create economic value and support many activities.
- Misconception: Wheat, flour and biscuits should all be counted separately in the same production chain. Correct: Final biscuit value already includes intermediate inputs.
- Misconception: The sector with the largest output necessarily employs the most workers. Correct: Output and employment shares measure different things.
- Misconception: Disguised unemployment means unwillingness to work. Correct: People work below their potential because adequate productive opportunities are unavailable.
- Misconception: Every service worker has a well-paid job. Correct: Many small service providers barely earn a living.
- Misconception: No rules exist for unorganised work. Correct: Rules exist, but they are often not followed.
- Misconception: Public and organised are two names for the same sector. Correct: Public refers to ownership, while organised refers to employment conditions.
Exam-style questions with model answers
Q1. Distinguish between the primary and secondary sectors, giving one example of each. [2 marks]
- The primary sector obtains natural products through the use of natural resources, as in cotton cultivation.
- The secondary sector transforms natural products through manufacturing, as when cotton fibre is spun into yarn and woven into cloth.
Q2. A biscuit production chain involves wheat sold for ₹20 per kg and flour sold for ₹25 per kg. Four packets of biscuits made using flour, sugar and oil sell to consumers at ₹20 each. Find the final value counted and explain why wheat and flour are not added separately. [3 marks]
- The value of the final biscuits is four multiplied by ₹20, giving ₹80. Biscuits reach the consumers and are the final goods in this chain.
- Wheat and flour are intermediate goods used in producing the biscuits. Their values are already included in the final biscuit price.
- Adding their values separately to ₹80 would count the same production more than once. The calculation therefore includes the final value without separately recounting intermediate inputs.
Q3. Explain four reasons for the growing importance of the tertiary sector in India. [4 marks]
- Basic services such as education, healthcare, administration, banking and transport are necessary for the country and require provision.
- Expansion of agriculture and industry raises demand for supporting services, including storage, transport and trade.
- Rising incomes lead some people to demand more tourism, eating out, private healthcare, private education and professional training.
- New services based on information and communication technology have become important and have expanded rapidly. These developments together increase service production, although every service activity does not grow equally.
Q4. Five members of Laxmi's family work on her two hectares of rain-dependent land. Two members can leave without reducing farm output and can earn wages elsewhere. Explain the unemployment involved and the effect of their move. [3 marks]
- This is disguised unemployment: all five appear employed, but the farm has more workers than needed to maintain its existing production.
- The fact that two members can leave without reducing output shows that their labour is not fully used on the original plot. It does not indicate laziness.
- If they obtain paid work elsewhere, the family gains wage income while its previous farm output continues. Total family income therefore increases.
Q5. Explain five measures that can create more productive employment in rural areas. [5 marks]
- Provide wells, canals and other irrigation facilities. More reliable water allows additional crops and increases agricultural work beyond a single rain-dependent season.
- Make reasonably priced bank credit available. Farmers can then purchase seeds, fertilisers, pumpsets and equipment in time to cultivate their land.
- Improve rural roads, transport and storage. Farmers can sell additional output, while related transport and trading activities create further employment.
- Encourage local processing activities such as dal mills, agricultural processing and honey collection centres. These provide opportunities close to rural producers.
- Expand schools and healthcare facilities. These require teachers, other school staff, doctors, nurses and health workers while also improving education and health.
Q6. Compare organised and unorganised employment on five grounds. [5 marks]
- Organised employment has regular terms and assured work, while unorganised employment is often irregular and insecure. Workers in the latter may be asked to leave without adequate security.
- Organised workers have fixed hours and are entitled to overtime payment for extra work. Such provision is generally absent in unorganised work.
- Organised workers receive paid leave and holidays. Unorganised workers commonly lose wages for days they do not work.
- Benefits such as provident fund, gratuity and medical support are associated with organised employment. Unorganised workers generally lack these protections.
- Organised enterprises are registered and required to follow employment rules and formal procedures. Unorganised units are small and scattered, and existing rules are often not followed.
Q7. Ahmedabad had 15,00,000 workers in 1997-98, with 11,00,000 in the unorganised sector. Total income was ₹60,000 million; organised income was ₹32,000 million. Calculate organised employment and unorganised income, and compare the two sectors. [3 marks]
- Organised employment equals total employment minus unorganised employment: 15,00,000 − 11,00,000 = 4,00,000 workers.
- Unorganised income equals total income minus organised income: ₹60,000 million − ₹32,000 million = ₹28,000 million.
- The unorganised sector had more workers but generated less total income than the organised sector. The comparison demonstrates why employment numbers and income must both be examined, while keeping workers and monetary units separate.
Q8. Explain why public sector activities are needed even when private enterprises operate in an economy. [5 marks]
- Infrastructure such as roads, bridges, railways and irrigation dams may require expenditure beyond what private enterprises can undertake at an affordable charge to users.
- Collecting payment from every user of shared facilities is difficult. Government spending helps make these facilities available more widely.
- Government can support production through affordable electricity, bearing part of the cost so that industries, particularly small units, can continue operating.
- Buying wheat and rice at fair prices and selling them more cheaply through ration shops supports farmers and consumers.
- Health, education, drinking water, nutrition, housing for poor people and support for neglected regions are responsibilities that extend beyond earning profits.
Key takeaways
- Primary activities obtain natural products, secondary activities manufacture goods, and tertiary activities provide services that support production and everyday life.
- The three sectors are interdependent through raw materials, manufactured inputs, transport, finance and demand for one another's output.
- GDP counts final goods and services produced within a country in a particular year, avoiding repeated counting of intermediate inputs.
- Production shares and employment shares must be examined separately because higher output does not necessarily create proportionately more jobs.
- Disguised unemployment exists when some apparently employed workers can move elsewhere without reducing the original activity's output.
- Irrigation, affordable credit, local processing, transport, education and healthcare can create productive work and improve living conditions.
- Organised and unorganised classifications concern employment conditions, while public and private classifications concern asset ownership and service provision.
- Government expenditure supports infrastructure, essential services, vulnerable workers and neglected regions whose needs cannot be judged by private profit alone.
Test yourself
Why is dairy a primary sector activity?
Milk is a natural product obtained through animals' biological processes, with production depending on factors such as available fodder.
Can manufacturing take place outside a factory?
Yes. Manufacturing may take place in a workshop or home as well as in a factory.
Why is flour intermediate in the biscuit example?
It is used to produce biscuits, and its value is already included in the final biscuits' value.
What does GDP stand for, and what period does its definition use here?
GDP stands for Gross Domestic Product and measures final production within a country during a particular year.
Does disguised unemployment occur only on farms?
No. Underemployment also affects urban casual workers and small service providers who lack sufficient or better work opportunities.
Which criterion distinguishes public from private activities?
The criterion is ownership of assets and responsibility for delivering services, rather than employment conditions.
What followed if government did not provide the employment guaranteed under MGNREGA 2005?
Unemployment allowances were payable when government failed to provide the employment guaranteed under that Act.
What replaced MGNREGA in 2025?
It was replaced by Viksit Bharat-Guarantee for Rozgar and Ajeevika Mission, abbreviated Viksit Bharat-G RAM G 2025.
Try it
Follow the shirt through the economy
The same product passes through all three sectors. Sort each activity.
Drop each activity under its economic sector.
Primary extracts from nature, secondary turns it into goods, tertiary provides services. One shirt passes through all three — and in India the tertiary sector earns the most while the primary sector still employs the most people.