
Interpretation of Topographical Maps | ICSE Class 10 Geography Notes
On this page
This note covers topographical maps, grid references, directions, map scales, direct distances, areas of full grid squares, heights, contours, landforms, conventional signs, drainage, settlements, land use, transport and the interpretation of mapped features.
What does a topographical map show?
A topographical map represents a small area at a relatively large scale and shows its detailed natural and human-made surface features. Scale is the relationship between a distance on the map and the corresponding distance on the ground.
Natural features include hills, rivers and natural vegetation. Cultural features are human-made features, including buildings, roads and railways. A topographical map brings these features together, allowing their locations and relationships to be studied.
The Survey of India prepares topographical maps of India. Maps belonging to a series use a common scale and system of signs, symbols and colours. A map series is a group of maps prepared to common specifications for a region.
What should you read first?
Begin with the north line, which indicates north, the scale and legend, the key explaining the map's symbols and colours. The marginal information, printed around the map, includes its sheet number, location, scale and other reference information.
Relief means the elevations and depressions of the land surface. Drainage means the flow of water through defined channels. Reading relief and drainage together helps explain the arrangement of other features, rather than treating each symbol as an isolated fact.
Separate identification from interpretation. Identification names a visible feature. Interpretation examines relationships between features, such as the distribution of cultivated land in relation to relief and drainage. A conclusion should remain tied to the evidence visible on the sheet.
How do four-figure and six-figure grid references locate features?
A grid is a network of intersecting reference lines drawn across a map. A grid reference uses the numbered lines to locate a square or a position within it. Read the map's grid labels before attempting to locate a feature.
Eastings are the north-south grid lines whose numbers increase eastwards. Northings are the east-west grid lines whose numbers increase northwards. Their names describe the direction in which their values increase, rather than the direction in which the lines run.
How is a four-figure reference read?
A four-figure grid reference identifies a grid square. It gives the two-figure easting of the square's western boundary first, followed by the two-figure northing of its southern boundary. This is the square's lower-left corner on a north-up map, a map oriented with north towards the top.
- Find the feature and identify the grid square containing it.
- Read the easting at the western, or left-hand, boundary of that square.
- Read the northing at the southern, or lower, boundary of that square.
- Write the easting pair before the northing pair, retaining any initial zero printed in the reference.
How does a six-figure reference add precision?
A six-figure grid reference locates a position more precisely within a square. Imagine dividing the square into ten equal parts across and ten equal parts upwards. The extra digit in each half records the feature's position in these subdivisions.
Read the western easting and estimate the tenths eastwards to the feature. These make the first three figures. Read the southern northing and estimate the tenths northwards. These make the last three figures. Keep the easting group before the northing group.
Use the actual symbol being located, rather than an adjacent place-name label. A label may extend beyond the feature it names. Check that the resulting reference places the symbol within the same square you identified at the start.
Note: Four figures identify a square; six figures give a more precise position within it. The order remains easting first, northing second.
How are directions between places identified?
Direction describes the position of one feature relative to another using a reference direction. The north line provides the starting reference. Orient the sheet from that line before deciding where one place lies in relation to another.
The four cardinal points are north, south, east and west. Their abbreviations are N, S, E and W respectively. The intermediate directions are north-east, south-east, south-west and north-west, abbreviated NE, SE, SW and NW.
Which place is the starting point?
In a question asking for the direction of one place from another, the place following “from” is the starting point. Imagine standing there and looking towards the destination. Read the direction of that line using the map's north reference.
On a north-up map, east is to the right and west to the left. A destination lying above and to the right of the starting point is north-east. Reversing the starting point and destination reverses the direction, giving south-west in this relationship.
Use the eight named directions consistently. The direction of a settlement from another settlement describes their relative positions. A river's flow direction requires additional evidence about the downhill course of the water; its position on the page alone is insufficient.
How do statement, representative fraction and linear scales differ?
A statement scale expresses the map-to-ground relationship in words. “1 centimetre represents 10 kilometres” means that each centimetre measured on that map corresponds to ten kilometres on the ground. The units form part of the statement.
A representative fraction, abbreviated RF, gives the ratio of map distance to ground distance in the same units. In 1:50,000, the colon means “to”: one map unit represents 50,000 identical ground units. The ratio itself does not specify a particular unit.
The numerator is the map-distance part of the fraction, here 1. The denominator is the ground-distance part, here 50,000. Reading centimetres on one side and kilometres on the other without conversion would change the meaning of the ratio.
Which unit conversions are needed?
The abbreviations km, m, cm and mm mean kilometre, metre, centimetre and millimetre. The equals sign means “is equal to”. These relationships allow a measurement to be expressed in a suitable ground-distance unit.
| Unit | Equivalent length | Use in conversion |
|---|---|---|
| 1 km | 1,000 m | Convert kilometres to metres |
| 1 m | 100 cm | Convert metres to centimetres |
| 1 cm | 10 mm | Convert centimetres to millimetres |
A linear scale, also called a graphical or bar scale, is a line divided into labelled lengths. Its divisions show ground distances. Read both the main divisions and any smaller subdivisions, together with their stated units.
What happens when a map is resized?
A statement scale becomes unsuitable if the map is enlarged or reduced without updating the statement. A graphical scale remains valid when it is enlarged or reduced together with the map. Its drawn length changes in the same proportion as the mapped distances.
To convert RF into a statement, choose a unit, apply it to both sides and convert the ground length. For 1:50,000, one centimetre represents 50,000 centimetres, which equals 500 metres. This is the same relationship expressed in a more convenient form.
How are direct distances and full grid-square areas calculated?
Direct distance is the straight-line distance between two selected points. A ruler or pair of dividers can measure the separation on the map. A pair of dividers is an instrument with two pointed arms used to transfer distances.
- Identify the exact start and end points, using their symbols rather than the ends of their labels.
- Measure the straight line joining them on the map and record the unit.
- Read the scale and convert the measured map distance into the corresponding ground distance.
- State the answer with its ground-distance unit and check the unit conversion.
How does the scale conversion work?
At a scale of 1:50,000, 1 cm represents 500 m. Thus the ground distance in metres is the map distance in centimetres multiplied by 500. The multiplication sign, ×, means “multiplied by”.
| Map distance at 1:50,000 | Ground distance | Conversion |
|---|---|---|
| 1 cm | 500 m | 50,000 cm divided by 100 |
| 10 cm | 5 km | 500,000 cm divided by 100,000 |
| 15 cm | 7.5 km | 750,000 cm divided by 100,000 |
These are straight-line scale conversions. Measuring along a winding road would answer a different question about route length. Keep the measurement tied to the specified endpoints and the direct separation between them.
How is a complete grid square measured?
Area measures surface extent. First establish the ground length of a grid square's side using the sheet's scale and grid information. For a complete square, multiply its ground side length by itself. Multiply that area by the number of complete squares required.
Square kilometres, written km², measure area; the raised ² means “squared”. Likewise, m² means square metres. A length expressed in kilometres must be multiplied by another length in kilometres to obtain an area in square kilometres.
Area of complete squares = number of complete squares × ground side length × ground side length. Each quantity in this expression must refer to the same grid and consistent units. Do not apply a length conversion once and label the result as an area.
What do spot heights, triangulated heights and relative heights mean?
Elevation is the vertical height of a place above a reference level. Mean sea level is the average sea level used as a reference for mapped elevations. It differs from the height of a feature above the ground immediately beside it.
A spot height gives the elevation of an individual point. A dot and its accompanying number identify the point and height, according to the map's legend. It does not show the shape of the surrounding slope by itself.
A triangulated height gives the elevation of a survey point established through triangulation, a surveying method using a network of triangles. The conventional-sign key distinguishes the triangular station symbol from other height symbols.
How is relative height different?
Relative height is the vertical difference between a feature's top and its local base. Relative depth is a vertical difference measured downwards from a local reference surface. Neither expression automatically means height above mean sea level.
Read the legend and the context of the number before interpreting it. A local height or depth attached to a feature must not be treated as the elevation of the entire surrounding area. If two elevations are supplied, their difference gives their vertical separation.
What the figure shows
Height symbols
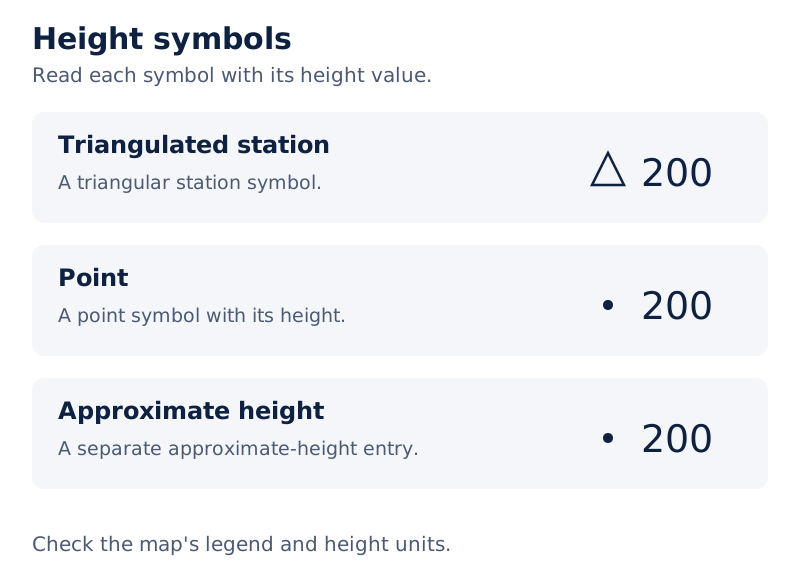
The key shows a triangular station symbol beside 200, a point symbol beside 200 and a separate approximate-height entry. These are distinct entries within the height row.
Drawn by One Young India.
Use point heights together with the surrounding contours, lines joining places of equal elevation above mean sea level. The point tells you about one location, while the contour pattern supplies information about the shape and slope of the land around it. Check the sheet's height units before comparing readings.
How do contours reveal slopes, hills, ridges and escarpments?
A contour is a line joining places of equal elevation above mean sea level. A contour interval is the vertical difference between successive contours. It is usually constant on a given map and is generally expressed in metres.
The contour interval is also called the vertical interval, sometimes abbreviated VI. The horizontal equivalent, sometimes abbreviated HE, is the horizontal distance between successive contours. This distance varies with the slope, even where the vertical interval remains constant.
How does contour spacing show slope?
Slope or gradient describes the steepness of the land. Closely spaced contours indicate a steep slope. Widely spaced contours indicate a gentle slope. With the same vertical interval, a shorter horizontal distance means a steeper rise or fall.
Read contour values as well as their spacing. Spacing shows steepness; increasing and decreasing values show the direction of rising and falling ground. Two contours of different elevation usually do not cross each other.
How are the main landforms recognised?
A hill is raised ground above its surroundings. Closed contours with values increasing towards the centre indicate a hill. A conical hill rises almost uniformly from the surrounding land and has a narrow top.
A conical hill with a uniform slope is represented by concentric contours spaced almost at regular intervals. Concentric means arranged around a common centre. Retain the qualification “almost”: the description does not require perfectly equal spacing.
A ridge is a long, narrow area of high ground. Its contour pattern is elongated, with higher ground along its length. An escarpment is a long, steep slope separating land at different levels; tightly packed contours mark its steep face.
An escarpment may be recognised in relation to gentler ground beside it. Examine the entire pattern rather than assigning a landform name to a single short contour segment. Shape, spacing and height values together provide the identification.
Note: The contour interval is a vertical difference. The visible gap between contour lines is a horizontal distance. Confusing them reverses the reasoning used to recognise steep and gentle slopes.
How are drainage direction and drainage patterns interpreted?
A drainage system is a network of water channels. A tributary is a stream joining a larger stream or river. A drainage pattern is the arrangement made by the connected channels across an area.
To identify flow direction, examine the river together with the surrounding height information. Water flows downhill, so the sequence of elevations helps establish the downstream direction. Use the north reference to name that direction on the sheet.
How do the three patterns differ?
Primary tributaries join the main river; secondary tributaries join those tributaries. A right angle is a square corner. This distinction helps you interpret the trellis arrangement across the network rather than looking at one junction alone.
| Pattern | Defining arrangement | What to inspect |
|---|---|---|
| Dendritic | Branching like the branches of a tree | The arrangement of the main stream and its branches |
| Trellised or trellis | Primary tributaries run parallel; secondary tributaries join them at right angles | Parallel channels and the angles of smaller junctions |
| Radial | Rivers originate from a hill and flow in all directions | The central high ground and outward-flowing channels |
Drainage patterns reflect several influences, including rock structure, topography, slope, the amount of flowing water and its periodicity. Periodicity here means the timing or recurrence of flow. A pattern name describes an arrangement; it does not by itself establish every environmental condition.
A radial pattern requires streams flowing outwards from high ground. Simply seeing several streams near one another is insufficient. Similarly, identify dendritic drainage by its branching network and trellised drainage by its parallel elements and right-angled secondary junctions.
How should conventional signs and colour tints be read?
Conventional signs are agreed symbols used to represent features on maps. A colour tint is a coloured area used to distinguish a mapped surface or land category. Both signs and tints must be interpreted with the sheet's legend.
The legend distinguishes features that may look similar at first glance. Water symbols, settlement symbols, vegetation signs and transport lines each carry particular meanings. Their shape, colour and arrangement matter together; colour alone is not a complete identification.
What information does the key provide?
What the figure shows
Conventional signs and symbols
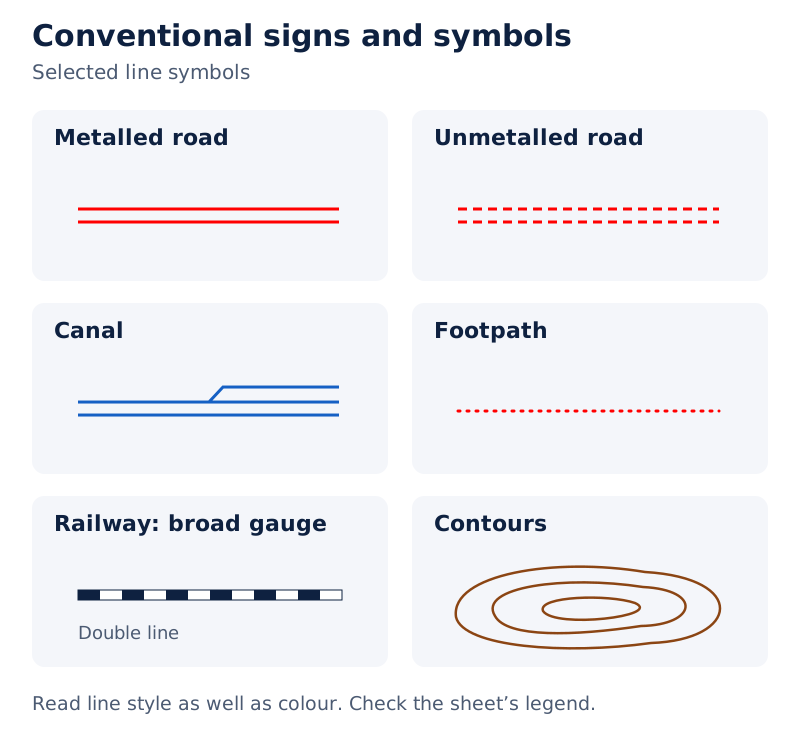
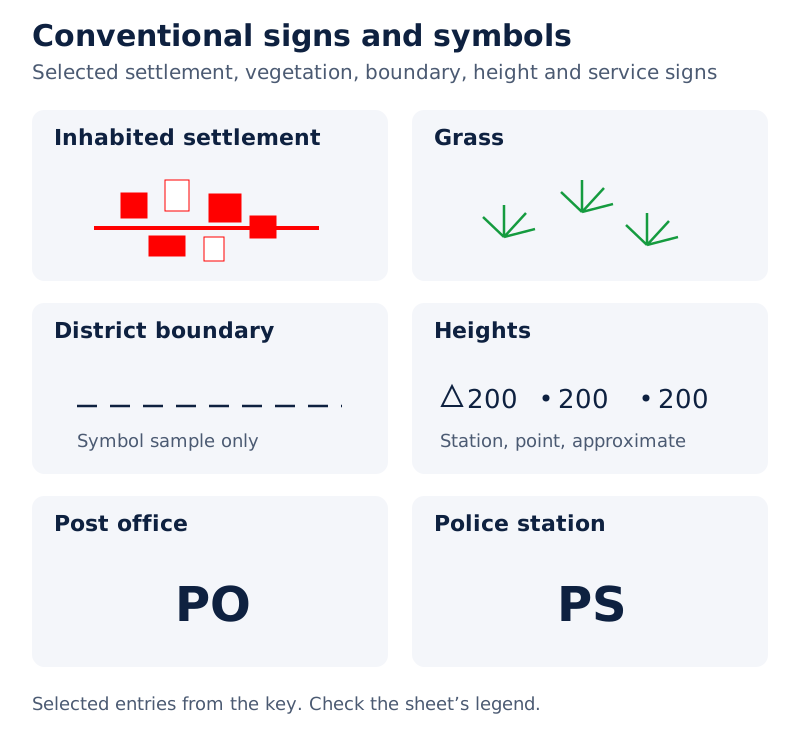
The key places labelled samples of roads, water features, railways, contours, settlements, vegetation, boundaries, heights and services in separate rows. It includes both line symbols and small point symbols.
Drawn by One Young India.
Common topographical colour conventions associate yellow tint with cultivated land and green tint with wooded cover. Uncoloured ground can indicate uncultivated land; it does not by itself prove that land is useless. Check these categories against the particular sheet’s legend.
In this key, road samples are red, several water symbols are blue, vegetation symbols are green and contours are brown. These observations help organise reading, but the individual legend entry remains necessary to identify the precise feature.
The letters PO mean post office and PS mean police station in the key. These abbreviations identify different services. Learn the full term alongside the abbreviation so that the map symbol becomes meaningful information about the settlement.
Land use describes how land is used, such as cultivation or industry. Land cover describes what covers its surface, such as vegetation or water. A coloured patch and its symbols should be read together before giving either description.
Classify natural and human-made features carefully. A river is a natural water feature; a canal is an artificial water channel. Both may involve blue water markings, so their category depends on the identified feature, not simply the colour.
How are settlements, services and land use interpreted?
A settlement is a group of dwellings where people live. Its site is the actual ground it occupies. Its settlement pattern is the spatial arrangement of its dwellings, which should be examined in relation to relief and drainage.
A clustered settlement has a compact or closely built-up group of houses. A dispersed settlement consists of isolated dwellings or small groups separated from one another. Examine the housing symbols across the relevant area before naming the pattern.
What can explain settlement location?
Water supply, food supply, relief, occupation and defence can influence settlement sites. Compare the settlement with the contour and drainage information. The location of houses near a river is an observation; a proposed reason for that location requires supporting evidence.
Alluvial plains are plains formed from river-deposited material. Clustered settlements are generally found in fertile alluvial plains and in the northeastern states of India. “Generally” matters: clustering is not restricted to one type of terrain.
Extreme dispersion is often caused by extremely fragmented terrain and land resources suitable for habitation. Terrain means the character of the ground. The qualification “often” leaves room for other influences on how settlements are distributed.
How are services and occupations identified?
Read the symbols for facilities such as schools, hospitals and post offices. These show services available at mapped locations. Keep the stated service linked to the correct settlement rather than transferring a nearby symbol to a different village.
Land use and settlement type may help identify the general occupation of people in an area. Cultivated land provides evidence of agriculture. In cities and towns, services and business appear to be major occupations. A map does not justify assigning one occupation to every resident.
How are transport and communication features distinguished?
Transport concerns the movement of people and goods. Communication concerns the transfer of information. Their mapped features include roads, tracks, railways, communication lines and post offices. The legend distinguishes these features through their conventional signs.
What do different road and track terms mean?
A metalled road has a prepared, hard surface. An unmetalled road lacks that metalled surface. A cart track is a track used by carts; a pack track is a route used by animals carrying loads.
A footpath is a path for people travelling on foot. Identify these routes through the supplied index. The terms describe different kinds of route, and the mapped line style helps you distinguish them.
Check junctions, bridges and connections to settlements. A bridge carries a route across an obstacle such as a watercourse. Reading connected routes gives more information about access than merely counting separate line segments.
Relief, population, settlement size and resource development influence the transport and communication network. Compare the routes with contours and settlement locations to examine these relationships. Describe the visible connections before suggesting why the network has developed in that form.
A mapped road indicates a route, while its conventional sign identifies its category. It does not supply a travel time or a vehicle speed. Similarly, a post-office symbol establishes a mapped communication service without specifying its staffing or frequency of service.
What does the Ganga map extract show in a case study?
Case study: Settlements and routes near the Ganga
The extract of sheet 63K/12 represents part of Mirzapur and Varanasi districts in Uttar Pradesh. A sheet number identifies a particular map within a series. The printed representative fraction is 1:50,000.
What the figure shows
Ganga and surrounding settlements
The blue Ganga River crosses the lower part of the extract diagonally. Numerous red settlement marks and connecting routes appear in the upper part. The name Kachhwa appears near a concentration of these features.
The extract permits several kinds of reading. The river is a natural feature; the settlement marks and roads represent human-made features. Their positions can be compared without assuming that each settlement has the same size, services or occupation.
The scale provides a second kind of information. At 1:50,000, one centimetre represents 500 metres. To obtain an actual direct distance, first measure between the specified endpoints on a correctly scaled copy of the extract.
Keep observation separate from measurement. The visible concentration of settlement marks can be described directly, but a numerical distance requires a measured map length. Likewise, the diagonal position of the river alone does not establish its flow direction.
What does the forest map extract show in a second case study?
Case study: Relief and drainage around Danti Reserved Forest
A second extract from sheet 63K/12 also covers part of Mirzapur and Varanasi districts. It contains numerous brown contours and the label Danti Reserved Forest. The forest name is printed across the central part of the extract.
What the figure shows
Forest, contours and watercourses
Brown contour lines surround branching blue watercourses. Red routes and settlement marks cross parts of the sheet. The label Lower Khajuri Dam appears near the upper edge, and the printed scale is 1:50,000.
A dam is a barrier built across a watercourse to hold back water. Its presence is a human-made feature within an area also displaying natural relief and drainage. The map combines these categories rather than presenting separate landscapes.
Begin interpretation by identifying the contours, watercourses and routes separately. Compare their distributions and then examine any relationship. Where contours are closer together, the slope is steeper than where they are farther apart for the same contour interval.
This comparison uses mapped evidence without assigning unsupported causes. The forest label, watercourses and road symbols establish what is shown. Statements about a particular crop, annual rainfall or the income of residents would require additional information.
Glossary
- Topographical map — A detailed, relatively large-scale map showing natural and human-made surface features of a small area.
- Legend — The key explaining the meanings of symbols and colours used on a map.
- Easting — A north-south grid line whose reference number increases towards the east.
- Northing — An east-west grid line whose reference number increases towards the north.
- Representative fraction — The ratio of map distance to corresponding ground distance, expressed in the same units.
- Linear scale — A divided and labelled line showing the relationship between map and ground distances.
- Contour — A line joining places with equal elevation above mean sea level.
- Contour interval — The vertical difference between successive contours, usually constant on a given map.
- Spot height — The elevation of an individual mapped point above the reference level.
- Relative height — The vertical difference between a feature's top and its local base.
- Ridge — A long, narrow area of high ground represented by elongated contour patterns.
- Escarpment — A long, steep slope separating areas of land at different levels.
- Dendritic drainage — A drainage pattern whose connected channels resemble the branches of a tree.
- Clustered settlement — A settlement in which houses form a compact or closely built-up group.
- Dispersed settlement — A settlement pattern of isolated dwellings or small groups separated from one another.
Common errors and misconceptions
- Misconception: Northings are read before eastings. Correct: Write the easting group first and the northing group second.
- Misconception: A four-figure reference identifies a precise point. Correct: It identifies a grid square; six figures locate a position more precisely within it.
- Misconception: The contour interval is the gap measured across the page. Correct: It is the vertical difference between successive contours.
- Misconception: Widely spaced contours indicate steep ground. Correct: They indicate a gentle slope; closely spaced contours indicate a steep slope.
- Misconception: A relative height is an elevation above sea level. Correct: Relative height is measured from a local base.
- Misconception: RF allows different units on its two sides. Correct: Both distances must use the same unit before the ratio is written.
- Misconception: A ground length in kilometres is also an area in square kilometres. Correct: A square's area is its ground side length multiplied by itself.
- Misconception: Every river drawn towards the bottom of a page flows south. Correct: Establish downhill flow from mapped evidence, then name its direction using north.
Exam-style questions with model answers
Q1. On a north-up map, a destination lies above and to the right of the starting point. Give its direction from the starting point and the reverse direction. [2 marks]
- The destination is north-east of the starting point because it lies both northwards and eastwards from it.
- The reverse direction, from the destination back to the starting point, is south-west.
Q2. A map has an RF of 1:50,000. Using 1 m = 100 cm, express this as a statement scale in metres and explain the equal-unit rule. [2 marks]
- One centimetre represents 50,000 centimetres, or 500 metres, on the ground.
- RF compares identical units on both sides, so centimetres must first be used for both map and ground distances.
Q3. The direct map distance between two points is 15 cm and the RF is 1:50,000. Given 1 km = 100,000 cm, calculate the ground distance in kilometres in three steps. [3 marks]
- Interpret the scale: one centimetre on this map represents 50,000 centimetres on the ground. The given measurement is a direct distance between the two endpoints.
- Multiply the map measurement by the scale denominator: 15 × 50,000 gives a corresponding ground distance of 750,000 centimetres.
- Convert to kilometres using the supplied relationship: 750,000 divided by 100,000 gives a direct ground distance of 7.5 kilometres.
Q4. A north-up map shows a feature within a numbered grid square. Without inventing grid numbers, describe four steps for writing its four-figure grid reference. [4 marks]
- Locate the feature's actual symbol and determine which complete grid square contains it, rather than using the position of its printed name.
- Read the two-figure easting on the western boundary of that square, which is its left-hand boundary on this north-up map.
- Read the two-figure northing on the southern boundary, which is the square's lower boundary.
- Combine the easting pair followed by the northing pair, retaining any initial zero; the result identifies the square containing the feature.
Q5. Classify these three drainage descriptions and justify each: channels branch like a tree; primary tributaries run parallel and secondary tributaries join at right angles; streams originate on a hill and flow outwards in all directions. [3 marks]
- The first pattern is dendritic. The connected channels resemble the branches of a tree, which is the defining arrangement supplied in the description.
- The second pattern is trellised. Parallel primary tributaries, joined by secondary tributaries at right angles, provide the identifying combination of channel relationships.
- The third pattern is radial. The streams originate on central high ground and flow outwards in all directions, rather than converging towards that hill.
Q6. Five contour observations are supplied: widely spaced lines; closely spaced lines; closed contours increasing in height towards their centre; elongated contours enclosing long, narrow high ground; and tightly packed contours along a long, steep slope separating different land levels. Identify and explain each feature. [5 marks]
- The widely spaced contours indicate a gentle slope. The height difference between successive contours is spread over a relatively large horizontal distance on the ground.
- The closely spaced contours indicate a steep slope. The corresponding change in elevation occurs over a smaller horizontal distance, so the ground rises or falls more sharply.
- The closed contours with values increasing towards the centre indicate a hill. Their height values establish that the interior stands above the surrounding ground.
- The elongated contours enclosing long, narrow high ground indicate a ridge. The extended shape of the higher land is the essential identifying evidence in this description.
- The long, steep slope separating different land levels is an escarpment. The tightly packed contours correspond to the steep face described in the supplied observations.
Q7. One mapped settlement has closely grouped houses; another has isolated huts and small groups separated by open land. Identify each settlement pattern from these observations. [2 marks]
- The closely grouped houses form a clustered settlement, recognised by its compact built-up arrangement.
- The isolated huts and separated small groups form a dispersed settlement, recognised by the gaps between dwellings or groups.
Q8. A question asks for the area occupied by complete grid squares and supplies their number and the ground side length of each square in kilometres. Explain the calculation and final unit in three steps, without inventing numerical values. [3 marks]
- Use the supplied ground side length for each square, keeping its unit as kilometres. A complete square has equal length and breadth.
- Multiply this side length by itself to obtain the area of one complete square. The resulting unit is square kilometres because two lengths have been multiplied.
- Multiply the area of one square by the supplied number of complete squares. State the total in square kilometres, written km², rather than in kilometres.
Key takeaways
- Begin with the north reference, scale and legend so that locations, measurements and symbols are interpreted consistently.
- Write eastings before northings; four figures identify a square, while six figures locate a position more precisely.
- Convert map lengths using the stated scale, and calculate full-square areas from ground side lengths in consistent units.
- Contours show equal elevations; their spacing indicates slope, while their values reveal the direction of rising ground.
- Distinguish height above mean sea level from relative height or depth measured against a local reference.
- Recognise dendritic, trellised and radial drainage by the arrangement and connections of the channels.
- Read settlements, transport, services and land use together, keeping interpretations tied to visible evidence on the map.
- Preserve qualifications: contour intervals are usually constant, and settlement or occupational relationships need not apply to every place or person.
Test yourself
What is a topographical map?
A detailed map of a small area showing natural and human-made features at a relatively large scale.
Why are north-south grid lines called eastings?
Their numbers increase eastwards, even though the lines themselves run north-south.
What does the third digit of each half of a six-figure reference add?
It estimates the position in tenths within the grid square, eastwards first and northwards second.
Why can contour spacing vary while the contour interval stays constant?
The contour interval is vertical, while the spacing is horizontal and changes with the steepness of the slope.
What distinguishes a radial drainage pattern?
Streams originate on a hill and flow outwards in all directions.
Why should the legend be consulted even when a colour seems familiar?
Individual symbols and line styles distinguish different features that may share a colour.
How does a graphical scale respond when resized together with a map?
It changes proportionally with the map and therefore continues to represent the corresponding ground distances.
What separates a relative height from a spot elevation?
Relative height uses a local base; a spot elevation uses the map's reference level, normally mean sea level.
Write about it
Turn a question from this chapter into a paper.
The Writing Studio has a structure guide, a rubric and citation tools for 15 formats, from essays to research papers. Drafting is free with an account. Learnacy Essential adds feedback from an AI writing coach and submission to The OYI Review.
Learnacy Essential is ₹1,499 for the year. Publication depends on review and is not guaranteed.