
Representation of Geographical Features | ICSE Class 6 Geography Notes
On this page
This note covers maps, sketches, plans and globes, the importance and elements of maps, large and small scales, distance measurement, directions, symbols, and diagrams of rivers, meanders, tributaries, distributaries, deltas, anticlines, synclines and block mountains.
What are maps, and why are they useful?
A map is a simplified representation of the whole Earth or part of its surface on a flat surface, drawn at a reduced scale. A scale shows the relationship between a distance on the map and the corresponding distance on the ground.
A map presents an area as if it were being viewed from above. It can represent a village, a town, a district, a country or the world. An atlas is a book or collection of maps.
How does a map help us?
Maps help us locate places, compare their positions and work out how to reach them. A city map can show a railway station, school, hospital, market and public garden. Roads connect the places shown and help a reader follow a route.
Distance tells us how far apart places are. Direction tells us where one place lies in relation to another. A symbol is a sign used to represent a feature. These are three important components of maps.
Maps also help us select information for a particular purpose. A reader looking for a road needs different information from someone studying mountains. A map simplifies the real world so that relevant features can fit into the space available.
What the figure shows
An imaginary small city
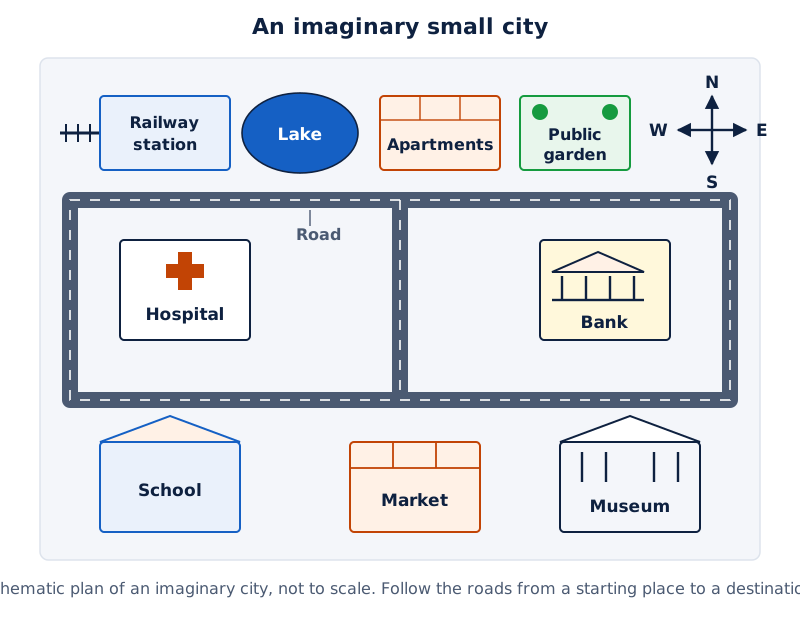
The drawing shows roads, a railway station, a lake, apartments, a hospital, a school, a market, a bank, a museum and a public garden. Direction arrows appear at the upper right.
Drawn by One Young India.
The city drawing illustrates an important reading habit: identify the starting place and destination before following the connecting roads. A straight line between buildings and a journey along roads are different measurements. Use the route actually being asked about.
How do a map, sketch, plan and globe differ?
A sketch is a rough, freehand drawing of an area that does not preserve an accurate scale. It can communicate the arrangement of familiar places, but its drawn distances should not be treated as measured ground distances.
A plan is a detailed drawing of a small area at a large scale, such as a building or school grounds. Here, large scale means that a relatively small ground distance is represented by a given distance on paper.
A globe is a spherical model carrying a map. A globe of the Earth represents its overall shape better than a flat map. The Earth is nearly spherical, with slight flattening at the poles, the northern and southern ends of its axis, the imaginary line about which it rotates.
Which representation suits the purpose?
| Representation | Main characteristic | Suitable use |
|---|---|---|
| Map | Reduced representation using a scale | Locating places and measuring distances |
| Sketch | Rough drawing without an accurate scale | Showing the arrangement of familiar places |
| Plan | Detailed representation of a small area | Showing a building or school layout |
| Globe | Spherical representation of the Earth | Studying the Earth as a whole |
A flat sheet cannot reproduce a spherical surface accurately in every respect. Flattening pieces of orange peel helps illustrate the problem: the pieces cannot lie flat without tearing at their edges. This explains why a globe and a world map are not identical representations.
For a locality, a plan or map can provide detail that is difficult to show on a globe. Choose by purpose: overall shape, detailed layout, measured distance or rough guidance. A neat sketch remains a sketch if it has no reliable scale.
What information should we look for when reading a map?
Begin with the title, which identifies the area or subject represented. Next, read the scale, the direction information and the key, also called the legend, which explains the symbols used. Together, these help turn marks on paper into geographical information.
How do the elements work together?
The scale answers a distance question. The direction information helps locate one feature relative to another. The key tells the reader what a mark means. A symbol's shape alone is not a reason to assume that it represents a particular feature.
Physical maps mainly show natural features such as mountains, oceans and rivers. Political maps show countries or states, boundaries and cities. Thematic maps show a specific kind of information rather than a general selection of features.
These names describe what maps show. They are different from the classification into large-scale and small-scale maps, which describes the relationship between map distance and ground distance. Keep the two kinds of classification separate when comparing maps.
- Read the title to identify the area or topic shown.
- Find the direction indicator and establish which way is north.
- Read the scale before interpreting any measured distance.
- Use the key to identify symbols, then locate the features needed.
For example, recognising a railway station symbol locates a possible starting point. Finding a school symbol identifies a destination. Directions help compare their positions, while the scale converts a measured line or route into a ground distance.
Map reading therefore involves more than recognising names. A complete interpretation connects the feature, its position and its distance from another feature. If a question supplies a key or scale, use that information for that particular map.
Case study: How do coordinates locate India on a map?
Latitude and longitude form a system of coordinates for locating places. Latitude is measured north or south of the Equator, and longitude east or west of the Prime Meridian. Both are expressed in degrees.
India extends approximately from 8°N to 37°N in latitude and 68°E to 97°E in longitude. The letters N and E indicate positions north of the Equator and east of the Prime Meridian. These coordinates describe geographical position, while the map scale is used to interpret distances.
How do large-scale and small-scale maps differ?
A large-scale map shows a small area with more scope for detail. A small-scale map shows a large area with more generalised information. Generalised information is simplified information selected to suit the purpose and scale of the map.
A world map and a district map help illustrate this difference. The world map must fit a much larger area into the available space. The district map can give more space to features within that district.
Does a large sheet mean a large scale?
The physical size of the paper does not determine the scale. A wall map may occupy a large sheet while representing a very large ground area at a small scale. Read the scale itself before deciding how much reduction has taken place.
| Point of comparison | Large-scale map | Small-scale map |
|---|---|---|
| Area represented | Relatively small area | Relatively large area |
| Information | Greater scope for local detail | More generalised representation |
| Examples | Village maps and city plans | Atlas maps and wall maps |
Scale can be written as a ratio, a comparison of two quantities. In the scale 1:500, the colon means “to”: one unit on the map represents 500 of the same units on the ground. The units must match.
Compare 1:500 with 1:4,000. The first is the larger scale because the same map length represents less ground distance. Both are examples of large scales used for detailed mapping; the comparison tells us which of these two is larger.
Do not confuse “larger scale” with “larger number after the colon”. A greater ground distance represented by the same map length means greater reduction. This is why a map covering a wider area has less room for small features.
How is scale represented and used?
Definition: Map scale is the ratio between a distance on the map and the corresponding distance between the same points on the ground.
A statement scale expresses this relationship in words. A representative fraction expresses it as a ratio using the same units. A graphical scale, or bar scale, uses a divided line labelled with the ground distances represented.
The length units used here are the centimetre, written cm, the metre, written m, the kilometre, written km, and the millimetre, written mm. The sign = means “equals”; in a map-scale statement, it indicates the ground distance represented.
| Metric unit | Equivalent length |
|---|---|
| 1 kilometre | 1000 metres |
| 1 metre | 100 centimetres |
| 1 centimetre | 10 millimetres |
What do the different scale statements mean?
| Scale information | Meaning |
|---|---|
| 1 cm represents 10 km | Each centimetre on this map represents ten kilometres on the ground. |
| 1:24,000 | One unit on this map represents 24,000 of the same units on the ground. |
| 2.5 cm represents 500 km | This printed map length represents five hundred kilometres on the ground. |
The examples describe different scales. Do not combine them into one calculation. Select the scale belonging to the map being used, and keep the distinction between a distance measured on paper and the distance it represents.
A statement scale needs to be changed if a map is enlarged or reduced. A bar scale remains useful when it is enlarged or reduced in the same proportion as the map. Its drawn length changes along with the features being measured.
Scale gives meaning to measurement. A ruler alone tells us a length on paper; the map scale tells us the corresponding length on the ground. Record both the number and its unit so that the answer is clear.
How can we measure distances and draw a playground plan?
For a straight distance, place a ruler between the two points on the map and read the length. Convert that map length using the stated scale. Check that the answer describes the ground distance, with the correct unit.
A winding river or road requires a different approach. Lay a thread along the line from the starting point to the endpoint. Straighten the thread, measure its length and convert that measurement using the map's scale.
How do we convert ground measurements into drawing lengths?
Consider a rectangular school playground whose length is 40 m and width is 30 m. Use the scale 1 cm represents 10 m. A rectangle is a shape with four right angles and equal opposite sides.
- Read the scale: each centimetre on the plan must represent ten metres on the ground.
- Divide the ground length, 40 metres, by ten metres per centimetre. The drawing length is 4 centimetres.
- Divide the ground width, 30 metres, by ten metres per centimetre. The drawing width is 3 centimetres.
- Draw a rectangle 4 centimetres long and 3 centimetres wide, then label the ground dimensions and scale.
Diagram
School playground plan
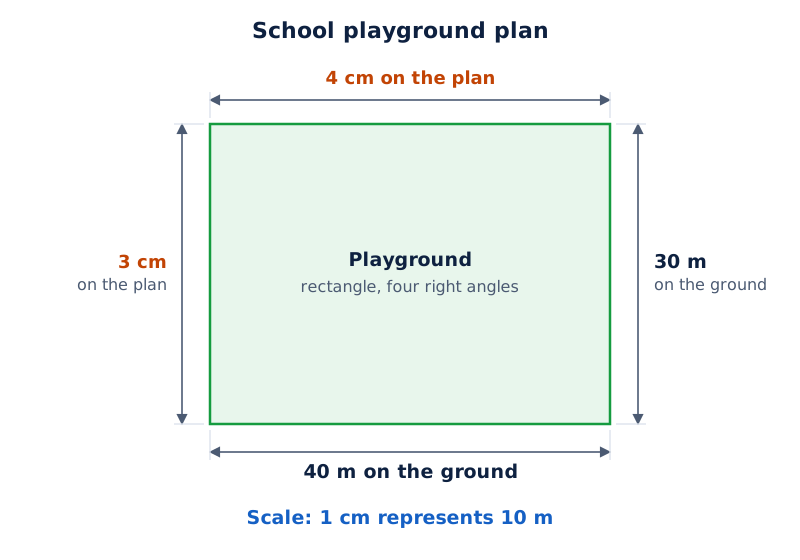
Draw a rectangle measuring 4 cm by 3 cm. Label the longer side “40 m” and the shorter side “30 m”. Write “Scale: 1 cm represents 10 m” below the plan.
Drawn by One Young India.
Check the result in reverse: four centimetres represent forty metres, and three centimetres represent thirty metres. Both dimensions have been reduced using the same scale. Using different scales for length and width would change the playground's shape.
The calculation gives drawing dimensions; the labels give ground dimensions. Do not label the drawing as a playground only four centimetres long. The purpose of the plan is to represent a much larger space clearly on paper.
How do the eight main directions help us locate places?
The four cardinal directions are north, east, south and west. Their abbreviations are N for north, E for east, S for south and W for west. Moving clockwise, in the direction followed by the hands of a clock, from north gives east, south and west.
The four intermediate directions lie between these cardinal directions. They are northeast, southeast, southwest and northwest, written NE, SE, SW and NW, respectively. Together, the cardinal and intermediate directions form the eight main compass points.
| Intermediate direction | Position |
|---|---|
| Northeast | Between north and east |
| Southeast | Between south and east |
| Southwest | Between south and west |
| Northwest | Between north and west |
How should we use the north arrow?
Most maps have an arrow marked N that points north. Establish north from this indicator before finding other directions. When north points towards the top of the page, east is to the right, south below and west to the left.
What the figure shows
Cardinal and intermediate directions
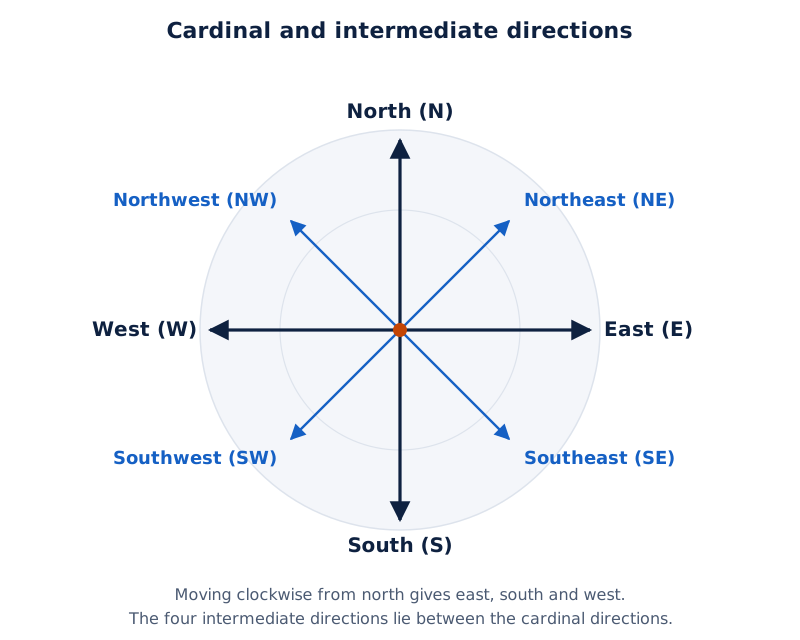
The compass drawing places north above south and west to the left of east. Northeast, southeast, southwest and northwest occupy the spaces between the four cardinal directions.
Drawn by One Young India.
A direction statement needs a reference place. “The museum is southeast of the bank” identifies the bank as the starting reference and the museum as the place being located. “Southeast” alone does not tell the reader which two places are being compared.
In a direction diagram, read from the reference point towards the destination. If the reference and destination are exchanged, the direction is reversed. Always check the wording before naming a direction, especially when several buildings appear close together.
How do symbols make maps easier to read?
Map symbols represent features without requiring a detailed picture of every object. Roads, railway lines, buildings, rivers, ponds and forests can be represented by selected signs. This allows numerous details to fit into the limited space on a map.
Conventional symbols are signs agreed for use within a mapping system. Different countries use different sets of symbols. In India, the Survey of India, a government body, has fixed a set of symbols for maps of India or its parts.
Why should we read the key?
The key or legend explains what the symbols mean. Consult it before interpreting a line, shape, colour or abbreviation. A symbol must be understood in the mapping system being used; familiar appearance alone is not enough.
Some symbols use letters. PO means Post Office, PTO means Post and Telegraph Office, PS means Police Station, and RS means Railway Station. Define such letters when using them in a drawing so that the reader can interpret them.
What the figure shows
Selected map symbols
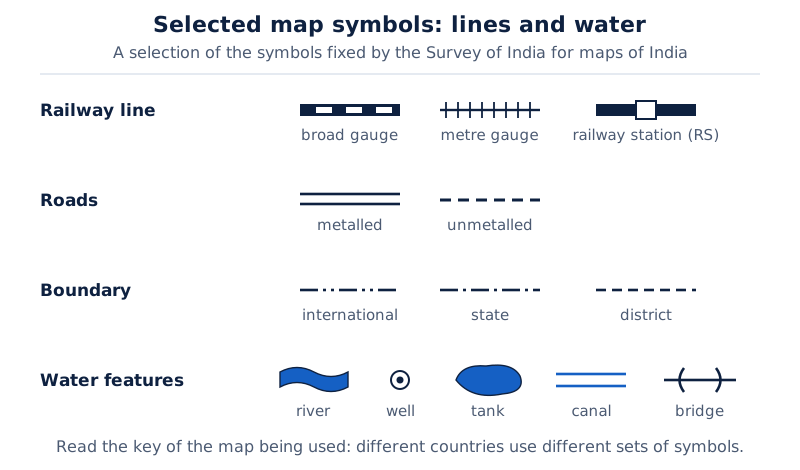
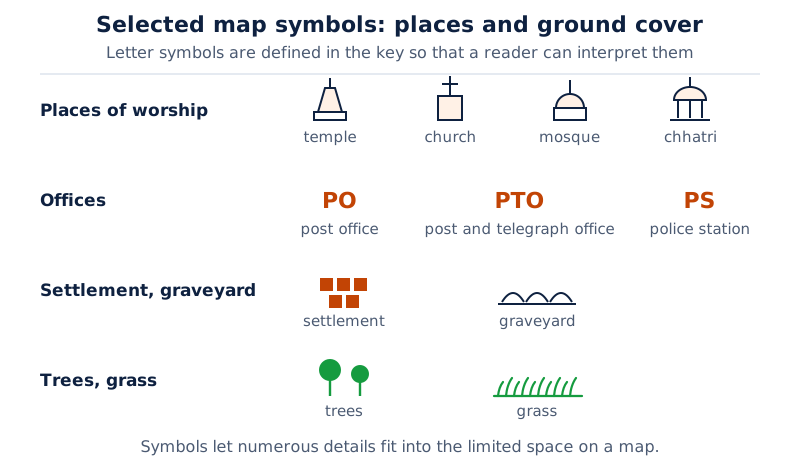
The chart groups symbols for railway lines and stations, roads, boundaries, water features, places of worship, offices, settlements, trees and grass. It includes the letter symbols PO, PTO, PS and RS.
Drawn by One Young India.
A boundary is a line separating areas, such as countries, states or districts. The chart distinguishes boundary types rather than using one undifferentiated line for all of them. It also separates road symbols from railway symbols.
For a locality drawing, select symbols for the features actually being represented. Place each symbol at the appropriate location, add a key and show directions. Consistent symbols make the drawing readable without filling the page with large pictures of buildings.
How do diagrams show rivers, tributaries and meanders?
A river is a natural flow of water along a channel. A channel is the course through which the water flows. A tributary is another river or stream that joins a main river.
A river diagram should distinguish the main channel from streams joining it. Arrows can show the direction of water flow. In a tributary diagram, the arrows on the joining streams lead towards the main river, not away from it.
What is a meander?
A meander is a large bend in a river. As a river enters a plain, it twists and turns. A plain is an extensive, flat or gently undulating area of land. Undulating means gently rising and falling. A bending river channel is different from a branching one.
Erosion is the wearing away of the landscape by agents such as water. Deposition is the laying down of transported material. Along a meander, continuing erosion and deposition bring the ends of a loop closer together.
In due course, the loop is cut off from the river and forms an ox-bow lake, a cut-off, curved lake. A meander remains part of the flowing channel, whereas the cut-off lake is separated from it.
What the figure shows
River features on a floodplain
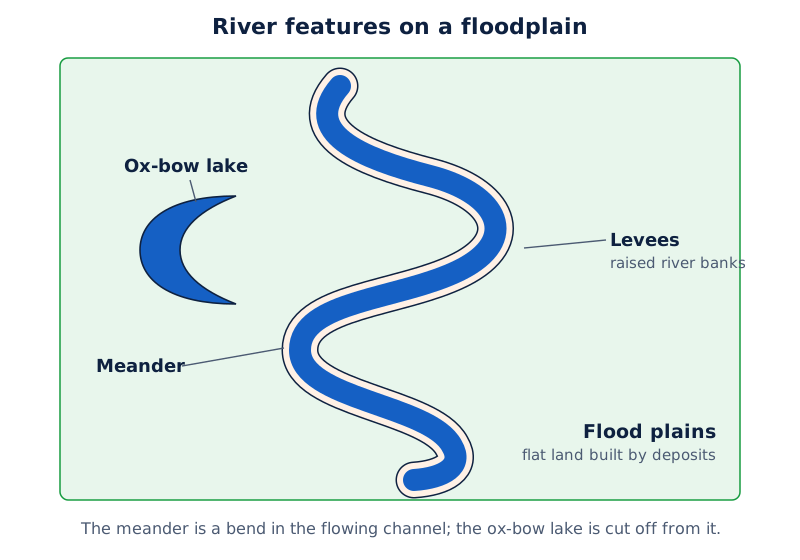
A winding blue river crosses a green plain. The drawing labels a meander, an ox-bow lake, flood plains and levees. The ox-bow lake is shown separately from the main channel.
Drawn by One Young India.
A floodplain is flat land built from material deposited when a river floods. Levees are raised river banks. These labels help explain the setting of the meander diagram; the meander itself is the bend in the channel.
Diagram
A river and its tributaries
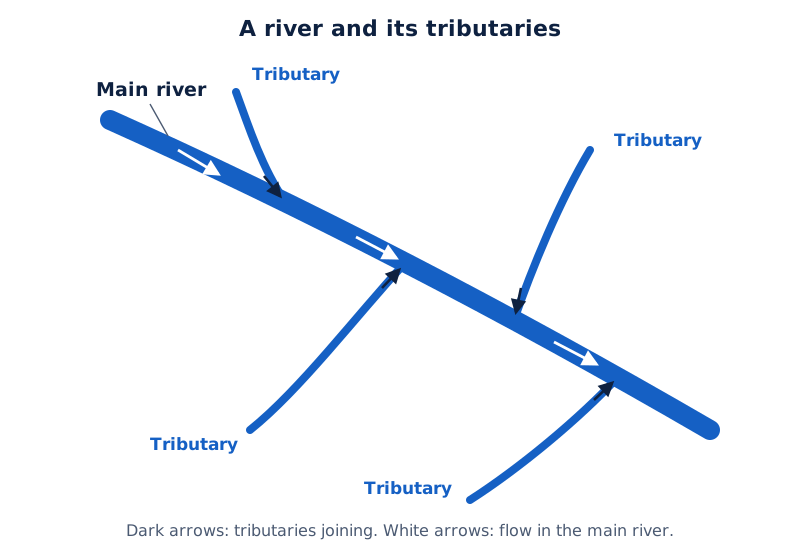
Draw a main river with smaller streams joining it. Label “main river” and “tributaries”. Add arrows that show water moving from the joining streams into the main channel.
Drawn by One Young India.
Case study: What do the Ganga and its tributaries illustrate?
The Ganga is nearly 2,500 km long and originates in the Himalayas. It has numerous tributaries, which are rivers that join it. The Yamuna and the Ghagara also originate in the Himalayas, while the Son, or Sone, originates in the Vindhya Range south of the Ganga plain.
This example connects the term tributary with named rivers: the Yamuna, Ghagara and Son join the Ganga. Their joining relationship distinguishes tributaries from distributaries, which branch away from a main river.
How are distributaries and deltas represented?
A distributary is a stream that branches away from a main river. During delta formation near the sea, the river divides into distributaries. This is the opposite joining relationship from a tributary, which brings water into the main river.
A river's mouth is where it enters the sea or another water body. Sediments are materials, such as fine soil and sand, carried and deposited by water. A delta is land built up by river deposits at its mouth.
How does deposition form a delta?
- As a river approaches the sea, the speed of the flowing water decreases.
- In delta formation, the river breaks into streams called distributaries.
- The slower water deposits material it has been carrying.
- Each distributary has its own mouth, and accumulated deposits build the delta.
What the figure shows
A delta
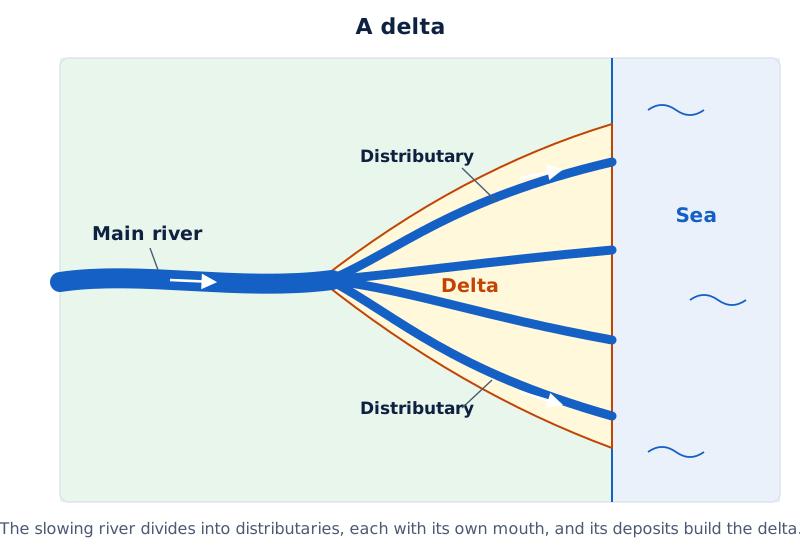
The drawing shows a main river dividing into several channels across land beside the sea. Its labels identify the main river and a distributary. The branches spread across the deposited land.
Drawn by One Young India.
The diagram contains both water channels and land. The distributaries are the channels carrying water away from the main river. The delta is the accumulated land between and around these channels. These terms therefore name different parts of the same scene.
To compare tributaries and distributaries, follow the arrows showing flow. Joining arrows indicate tributaries; separating arrows indicate distributaries. Do not decide from whether a branch points upwards or downwards on the page, because a diagram may be drawn in different orientations.
A delta explanation needs the connection between reduced speed and deposition, not merely a branching outline. When drawing one, label the main river, distributaries, delta and sea. Use the branching channels and deposited land together to communicate the feature.
How do diagrams distinguish anticlines, synclines and block mountains?
Folding is the bending of rock layers under pressure. In a simple upright fold, an anticline is an upward arch and a syncline is a downward trough. A trough is a hollow between higher parts.
These features are easiest to show in a cross-section, a drawing of an imagined cut through the ground. It reveals the rock layers beneath the surface. A top view of the land alone would not show their internal bending clearly.
How should we draw a simple fold?
Diagram
Anticline and syncline
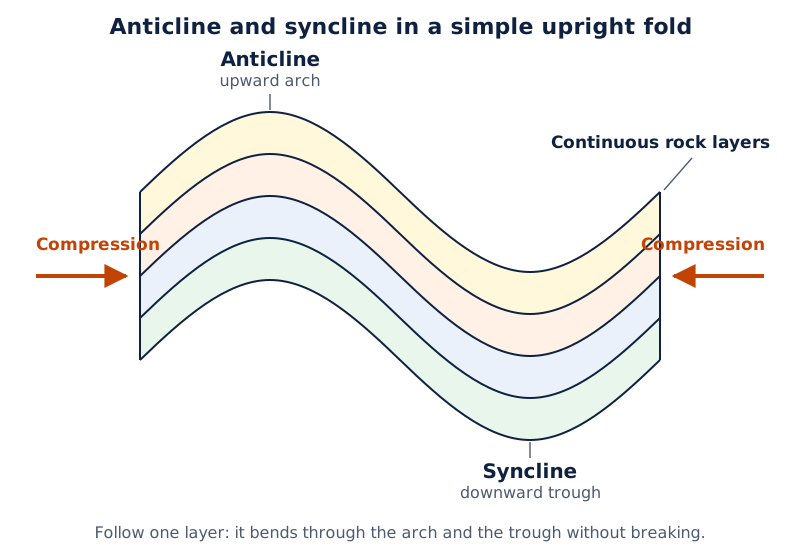
Draw continuous, parallel rock layers bending into an upward arch followed by a downward trough. Label the arch “anticline” and the trough “syncline”. Draw inward-pointing arrows at the sides to represent compression, or squeezing pressure.
Drawn by One Young India.
Follow a layer through the whole drawing. In this simple model, it bends through both features without breaking. Place labels on the folded layers so that the reader can distinguish the upward and downward parts of the fold.
How does a block mountain differ?
Faulting involves breaking and displacement, or movement from an earlier position, of rocks. A fault is a fracture along which rock has moved. A block mountain is a block of the Earth's crust, its outermost solid layer, standing higher than adjoining blocks because of movement along faults.
In a block mountain diagram, the important relationship is between higher and lower blocks separated by faults. The drawing should show breaks and relative displacement rather than a continuous arch of bent layers.
Diagram
A block mountain
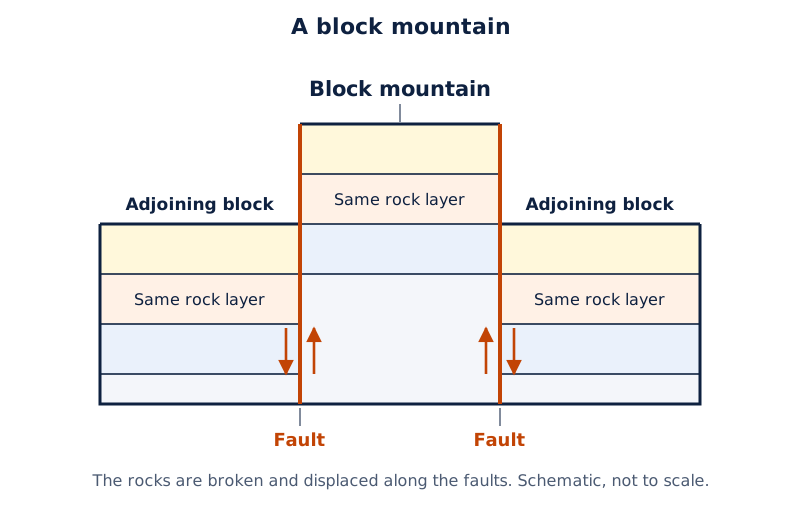
Draw a central crustal block standing above neighbouring blocks. Mark the faults separating the blocks and label the higher block “block mountain”. Show corresponding rock layers at different heights across the faults.
Drawn by One Young India.
Folding and faulting therefore require different drawing features. Curving, continuous layers communicate the simple anticline and syncline; displaced layers across breaks communicate faulting. Each diagram needs a title, clear labels and a brief explanation of the process represented.
Glossary
- Map — A simplified representation of all or part of the Earth's surface on a flat surface at a reduced scale.
- Sketch — A rough freehand drawing of an area without an accurately preserved scale.
- Plan — A detailed drawing of a small area using a large scale.
- Globe — A spherical model carrying a map, used to represent the Earth as a whole.
- Scale — The relationship between a map distance and the corresponding distance on the ground.
- Key — The part of a map that explains the meanings of its symbols.
- Cardinal directions — The four principal directions: north, east, south and west.
- Tributary — A river or stream that joins another river and supplies water to it.
- Distributary — A stream that branches away from the main river channel.
- Meander — A large bend in a river as its channel twists across a plain.
- Delta — Land built by the accumulation of sediments deposited at a river's mouth.
- Anticline — The upward arch of rock layers in a simple upright fold.
- Syncline — The downward trough of rock layers in a simple upright fold.
- Fault — A fracture in rock along which movement has taken place.
- Block mountain — A crustal block standing higher than adjoining blocks because of movement along faults.
Common errors and misconceptions
- Misconception: Any neat drawing is a map suitable for measurement. Correct: A rough sketch does not preserve an accurate scale, even if it is carefully drawn.
- Misconception: A large-scale map must cover a large area. Correct: Large-scale maps show smaller areas with greater scope for detail; small-scale maps show larger areas.
- Misconception: The top of every map must be north. Correct: Read the direction indicator. Most maps use an arrow marked N to identify north.
- Misconception: A map symbol has the same meaning in every country. Correct: Different countries use different sets of symbols. Consult the key for the map being read.
- Misconception: Tributaries and distributaries both join the main river. Correct: Tributaries join it; distributaries branch away from it. Follow the direction of water flow.
- Misconception: A delta is simply another name for a distributary. Correct: A distributary is a channel, while a delta is land built from deposited sediments.
- Misconception: An anticline is a downward fold. Correct: In a simple upright fold, the anticline is the upward arch and the syncline is the downward trough.
- Misconception: A block mountain is shown by bending continuous rock layers. Correct: Show faults and blocks at different relative heights. Continuous bending represents folding.
Exam-style questions with model answers
Q1. State two differences between a sketch and a plan. [2 marks]
- A sketch is a rough freehand drawing without an accurate scale; a plan uses a scale.
- A sketch gives a rough arrangement of places; a plan shows a small area's layout in detail.
Q2. A rectangular playground is 40 metres long and 30 metres wide. The scale is 1 centimetre represents 10 metres. Calculate its length and width on the plan, then state the complete rectangle dimensions. [3 marks]
- For the length, divide forty metres by ten metres represented per centimetre. The playground's length on the plan is therefore 4 centimetres.
- For the width, divide thirty metres by ten metres represented per centimetre. The playground's width on the plan is therefore 3 centimetres.
- Draw a rectangle 4 centimetres long and 3 centimetres wide. Label its ground dimensions and write the given scale beside it.
Q3. Compare large-scale and small-scale maps in terms of area, detail and an example of each. [3 marks]
- A large-scale map represents a relatively small ground area, whereas a small-scale map represents a relatively large ground area.
- A large-scale map has greater scope to show local details. A small-scale map gives a more generalised picture of features across its wider area.
- A village map is an example of a large-scale map. An atlas map showing a large region is an example of a small-scale map.
Q4. A direction diagram has north at the top, east on the right, south below and west on the left. Name the intermediate direction between each neighbouring pair, starting between north and east and moving clockwise. [4 marks]
- Northeast lies between north and east. In the diagram described, this direction is towards the upper right.
- Southeast lies between east and south. In the diagram described, this direction is towards the lower right.
- Southwest lies between south and west. In the diagram described, this direction is towards the lower left.
- Northwest lies between west and north. In the diagram described, this direction is towards the upper left.
Q5. Explain in five points how a delta forms, including the meanings of distributary and delta. [5 marks]
- As a river approaches the sea, its flowing water slows down. This decrease in speed is important for the deposition of carried material.
- In delta formation, the river divides into streams called distributaries. A distributary is a channel branching away from the main river.
- The slower water deposits its load, meaning the material that it has carried. The deposited material includes sediments such as fine soil and sand.
- Each distributary develops its own mouth, the place where its water enters the sea. Material is deposited around these separate river mouths.
- The accumulated deposits build land called a delta. The delta is the deposited land, while distributaries are the channels spreading across it.
Q6. In a river diagram, arrows show smaller streams joining a main river; farther along, the main river splits into channels flowing towards the sea. Identify the joining streams and the separating channels. [2 marks]
- The joining streams are tributaries because they bring water into the main river.
- The separating channels are distributaries because they carry water away from the main river.
Q7. Explain six features to include in labelled diagrams of a simple upright fold and a block mountain: the layers, anticline, syncline, faults, relative block heights and the distinction between the processes. [6 marks]
- In the fold diagram, draw continuous rock layers curving together. Their unbroken, bent form shows that the layers have undergone folding.
- Label the upward arch of the simple upright fold as an anticline. Place the label beside the curved rock layers forming the arch.
- Label the downward trough as a syncline. It is the downward part of the fold, adjoining the upward arch in the drawing.
- In the block mountain diagram, mark faults between the blocks. A fault is a fracture along which movement of rock has occurred.
- Show the block mountain standing higher than adjoining blocks. Draw corresponding rock layers at different heights across the faults to show displacement.
- Explain that folding bends layers, whereas faulting breaks and displaces rocks. The two diagrams must show these different structures clearly.
Q8. State three reasons why symbols and a key are useful on a map. [3 marks]
- Symbols represent buildings, routes and natural features without drawing large pictures of each one, allowing numerous details to fit into limited space.
- A key explains the meaning of each symbol, so readers can identify what the marks on that particular map represent.
- Different countries use different sets of symbols. Reading the key helps avoid assuming that a familiar-looking mark has the same meaning everywhere.
Key takeaways
- A map represents the Earth or part of it at a reduced scale; a globe represents its overall spherical form.
- A sketch gives rough guidance, while a plan represents the detailed layout of a small area using a scale.
- Large-scale maps show smaller areas with more detail; small-scale maps show larger areas with more generalised information.
- Read the map's scale before converting measurements, and distinguish distances on the drawing from the ground distances represented.
- The eight main compass points combine four cardinal directions with four intermediate directions; use the north indicator to orient the map.
- Symbols save space, and the key explains them; different countries may use different sets of map symbols.
- Tributaries join a main river, distributaries branch away, meanders are bends, and deltas are land built by deposition.
- In simple fold diagrams, anticlines arch upwards and synclines bend downwards; block mountains require faults and relative displacement of blocks.
Test yourself
What is an atlas?
An atlas is a book or collection of maps.
Why is a globe useful for studying the Earth's overall shape?
It has a spherical form, so it represents the Earth's overall shape better than a flat map.
Why does a large sheet of paper not prove that a map has a large scale?
Scale describes the relationship between map and ground distances, not the physical size of the sheet.
At a scale of 1 centimetre represents 10 metres, what ground length does a 4-centimetre line represent?
It represents forty metres on the ground: each of the four centimetres represents ten metres.
How can you measure the length of a winding river on a map?
Lay a thread along its course, straighten and measure the thread, then convert the length using the map's scale.
What distinguishes a tributary from a distributary?
A tributary joins the main river; a distributary branches away from the main river.
How does an ox-bow lake differ from a meander?
A meander is a bend in a flowing river; an ox-bow lake is a loop cut off from that river.
What drawing features distinguish folding from faulting?
Folding is shown by bent rock layers; faulting is shown by breaks with displacement of rocks across them.
Write about it
Turn a question from this chapter into a paper.
The Writing Studio has a structure guide, a rubric and citation tools for 15 formats, from essays to research papers. Drafting is free with an account. Learnacy Essential adds feedback from an AI writing coach and submission to The OYI Review.
Learnacy Essential is ₹1,499 for the year. Publication depends on review and is not guaranteed.