
India's Population: Distribution, Density, Growth and Composition | CBSE Class 12 Geography Notes
On this page
Watch & explore
Start with a few high-quality watches, then dive into the notes below.
This note covers India's population distribution, the factors shaping settlement, population density, growth and its phases, regional differences, adolescents and youth, rural and urban composition, linguistic and religious diversity, working population and gender sensitivity.
What do population distribution and composition tell us about India?
Population distribution describes how people are spread across an area. India's distribution is highly uneven. Its population was 1,210 million in 2011, but this national total conceals substantial differences between states and Union Territories.
Population composition describes the characteristics of people within a population. These include age, sex, residence, ethnic characteristics, tribes, language, religion, marital status, literacy, education and occupation. Distribution concerns where people live; composition concerns the characteristics of those people.
How are population data collected?
A Census is an operation that collects population data. India's Census operation is held every ten years. The first population Census took place in 1872, whereas the first complete Census was conducted in 1881.
Keep the year attached to each figure. The population patterns and comparisons discussed here primarily refer to 2011. State names and territorial groupings accompanying these figures refer to the corresponding population data.
Which states account for the largest shares?
Uttar Pradesh had the highest population, followed by Maharashtra, Bihar and West Bengal. Together with Andhra Pradesh, Tamil Nadu, Madhya Pradesh, Rajasthan, Karnataka and Gujarat, these states accounted for about 76 per cent of the country's population.
By contrast, Jammu and Kashmir accounted for 1.04 per cent, Arunachal Pradesh for 0.11 per cent and Uttarakhand for 0.84 per cent. Their shares were very small despite their fairly large geographical areas. A large area therefore need not have a large population.
What the figure shows
India's population distribution, 2011
Dots represent population, with one dot standing for 200,000 persons. Dots are closely packed across much of the northern plain and sparse in the far north and parts of the west.
See Fig. 1.1 in your NCERT textbook
The map presents the spatial pattern, meaning the arrangement across places. Reading this pattern alongside state population shares helps separate the size of a territory from the number of people living within it.
Why is India's population distributed unevenly?
Uneven distribution suggests a close relationship between population and physical, socio-economic and historical factors. Physical factors concern the natural environment; socio-economic factors concern society and economic activity; historical factors include the earlier development of settlement and transport.
How do physical conditions influence settlement?
Climate, the prevailing weather conditions of a region, together with terrain, or the character of the land surface, and water availability largely determines population distribution. The North Indian Plains, deltas and Coastal Plains have a higher proportion of population than several interior and mountain regions.
The contrast includes interior districts of southern and central Indian states, the Himalayas, and some north-eastern and western states. Very hot and dry regions, and very cold and wet regions, have low population density, meaning fewer people per unit area.
Physical constraints do not act independently of development. Irrigation in Rajasthan, mineral and energy resources in Jharkhand, and transport networks in Peninsular states have produced moderate to high concentrations in areas that were previously very thinly populated.
Why do older settlements and cities retain concentrations?
The evolution of settled agriculture, meaning farming associated with established settlements, agricultural development and settlement patterns are important. Transport development, industrialisation, or the development of industry, and urbanisation, or the growth of urban areas and population, also shape distribution.
River plains and coastal areas remain major population concentrations. Even where land and water show signs of degradation, an early history of settlement and the development of transport networks help explain why the concentration remains high.
Delhi, Mumbai, Kolkata, Bengaluru, Pune, Ahmedabad, Chennai and Jaipur have high population concentrations associated with industrial development and urbanisation. These processes attract large numbers of rural-urban migrants, people moving from villages to towns and cities.
Note: An explanation of distribution should connect physical conditions with settlement history and economic development. Irrigation, resource development and transport show why previously thinly populated areas can develop greater concentrations.
How does density reveal pressure on land?
Definition: Population density is the number of persons per unit area. Here, persons per square kilometre is the unit; a square kilometre is written as km².
India's density increased from 117 persons per km² in 1951 to 382 persons per km² in 2011. Density relates population to land area, making it different from a state's share of the national population.
| Area | Density in 2011, persons per km² |
|---|---|
| India | 382 |
| Arunachal Pradesh | 17 |
| Bihar | 1,102 |
| West Bengal | 1,029 |
| Uttar Pradesh | 828 |
| Kerala | 859 |
| Tamil Nadu | 555 |
| National Capital Territory of Delhi | 11,297 |
Case study: How do Delhi and Arunachal Pradesh differ?
Delhi's 11,297 persons per km² contrasts with Arunachal Pradesh's 17. The contrast demonstrates wide spatial variation. Among states, Bihar has the highest density and Arunachal Pradesh the lowest. Bihar, West Bengal and Uttar Pradesh have higher densities among northern states; Kerala and Tamil Nadu have higher densities among Peninsular states.
Assam, Gujarat, Andhra Pradesh, Haryana, Jharkhand and Odisha have moderate densities. Himalayan hill states and north-eastern states, excluding Assam, have relatively low densities. Union Territories, excluding the Andaman and Nicobar Islands, have very high densities.
What the figure shows
India's population density, 2011
Shading and hatching distinguish density classes. The legend lists above 1,201, 801 to 1,200, 401 to 800, 101 to 400, and less than 100 persons per square kilometre.
See Fig. 1.2 in your NCERT textbook
How do physiological and agricultural density differ?
Ordinary density is a crude measure of the human-land relationship. More specific measures help examine pressure on agricultural land. Net cultivated area means the area under cultivation, while net cultivable area refers to land available for cultivation.
Physiological density = total population ÷ net cultivated area. The division sign, ÷, means divided by. This measure relates the whole population to cultivated land.
Agricultural density = total agricultural population ÷ net cultivable area. Agricultural population includes cultivators, agricultural labourers and their family members. Cultivators engage in cultivation; agricultural labourers provide labour in agriculture. These measures are significant where the agricultural population is large.
How are population growth and doubling time measured?
Population growth is the change in the number of people in a particular area between two points in time. The growth rate expresses that change as a percentage. Annual growth refers to one year; decadal growth refers to ten years.
Growth has natural and induced components. Natural growth is analysed through crude birth and death rates. A crude birth rate counts births per thousand population in a year; a crude death rate counts deaths on the same basis.
Induced growth concerns inward and outward movement of people, or migration. Thus, population change must be distinguished from births alone. India's annual population growth rate was 1.64 per cent in 2011.
What does the decadal formula mean?
Let g be the decadal percentage growth rate, p₁ the population of the base year, and p₂ the population of the later year. Both populations are measured in persons.
g = ((p₂ − p₁) ÷ p₁) × 100. Here, − means subtraction, × means multiplication, and the result is a percentage, written with the symbol %.
- Identify the base-year population and the later population for the same area.
- Subtract the base-year population from the later population to find the absolute change.
- Divide this change by the base-year population, keeping the base year in the denominator.
- Multiply by 100 to express the change as a percentage over the decade.
Definition: Population doubling time is the time a population takes to double at its current annual growth rate. It refers to a duration, whereas annual growth rate expresses percentage change over a year.
What are the four phases of India's population growth?
The history of population growth is not a single uniform trend. Changes in births, deaths and migration produced four distinct phases. A low growth rate can result from high births accompanied by high deaths, rather than from low births alone.
Why was 1901 to 1921 a stagnant phase?
Phase I, 1901 to 1921, was stagnant or stationary because growth was very low. The decade 1911 to 1921 even recorded negative growth. Birth rates and death rates were both high, keeping the increase small.
Poor health and medical services, widespread illiteracy and inefficient distribution of food and other necessities were largely responsible for high birth and death rates. Stationary growth does not mean that births and deaths stopped.
Why did growth become steadier from 1921 to 1951?
Phase II, 1921 to 1951, brought steady growth. Better health and sanitation reduced mortality, meaning deaths in the population. Improved transport and communication strengthened the distribution system. Birth rates remained high, producing faster growth than in the previous phase.
This improvement occurred against the background of the Great Economic Depression of the 1920s and World War II. The important demographic change was falling mortality while the crude birth rate continued to be high.
What caused the population explosion from 1951 to 1981?
Phase III, 1951 to 1981, was the population explosion, a period of very rapid growth. Mortality fell rapidly while fertility, meaning childbearing in the population, remained high. Average annual growth was as high as 2.2 per cent.
After Independence, centralised planning introduced developmental activities. Economic improvement supported better living conditions. The result was high natural increase. Increased international migration, including Tibetans, Bangladeshis, Nepalese and people from Pakistan, also contributed to the high growth rate.
How did growth change after 1981?
Phase IV, after 1981, saw the growth rate remain high but begin slowing gradually. A downward trend in the crude birth rate is held responsible. An increase in mean age at marriage and improved quality of life, particularly female education, affected this trend.
| Decade | Percentage growth | Place in the growth sequence |
|---|---|---|
| 1911 to 1921 | −0.31 | Negative growth during Phase I |
| 1921 to 1931 | 11.60 | Growth during Phase II |
| 1951 to 1961 | 21.51 | Rapid growth during Phase III |
| 1961 to 1971 | 24.80 | Rapid growth during Phase III |
| 1971 to 1981 | 24.66 | Rapid growth during Phase III |
| 1981 to 1991 | 23.85 | Slowing growth during Phase IV |
| 1991 to 2001 | 21.54 | Slowing growth during Phase IV |
| 2001 to 2011 | 17.64 | Slowing growth during Phase IV; provisional figure |
A declining positive growth rate still means a population is growing. The distinction is between the number of people and the speed of increase, not between population growth and an automatic fall in population.
How do population growth rates vary between regions?
National averages conceal regional variation, meaning differences between areas. For 1991 to 2001, Kerala, Karnataka, Tamil Nadu, Andhra Pradesh, Odisha, Puducherry and Goa had low growth rates that did not exceed 20 per cent over the decade.
Case study: What does Kerala's growth rate show?
Kerala recorded 9.4 per cent growth during 1991 to 2001, the lowest in this group and in the country. This is a decadal rate, so it must not be treated as an annual percentage or transferred to 2001 to 2011.
A belt across the north-west, north and north-central parts had relatively higher growth than the southern states. Its growth rate on average remained 20 to 25 per cent during 1991 to 2001.
This belt comprised Gujarat, Maharashtra, Rajasthan, Punjab, Haryana, Uttar Pradesh, Uttarakhand, Madhya Pradesh, Sikkim, Assam, West Bengal, Bihar, Chhattisgarh and Jharkhand. The regional comparison concerns growth rates, rather than total population or density.
What changed during 2001 to 2011?
Almost all states and Union Territories recorded lower growth rates than during 1991 to 2001. The rates fell in the six most populous states: Uttar Pradesh, Maharashtra, Bihar, West Bengal, Andhra Pradesh and Madhya Pradesh.
Among these six, the fall was smallest in Andhra Pradesh at 3.5 percentage points and largest in Maharashtra at 6.7 percentage points. A percentage point measures the arithmetic difference between two percentages.
Tamil Nadu and Puducherry registered some increase, by 3.9 and 7.1 percentage points respectively. These exceptions are why the reduction should be described as occurring in almost all states and Union Territories.
What the figure shows
India's population growth, 2001 to 2011
Shading and hatching group percentage growth into above 25, 20 to 25, 15 to 20, 10 to 15, and less than 10. The map represents change over a decade.
See Fig. 1.3 in your NCERT textbook
Why do adolescents and youth need particular attention?
Adolescents are people aged 10 to 19 years. They formed about 20.9 per cent of India's population in 2011. Within the adolescent population, males constituted 52.7 per cent and females 47.3 per cent.
These percentages use different bases. The first describes adolescents as a share of the total population; the other two describe males and females within that adolescent group. The distinction is essential when interpreting population composition.
What challenges affect adolescents?
Adolescents are regarded as a youthful population with high potential, but they are quite vulnerable if not guided and channelised properly. Challenges include early marriage, illiteracy, particularly female illiteracy, school dropouts and low nutrient intake.
Other concerns include a high rate of maternal mortality among adolescent mothers, meaning deaths associated with pregnancy and childbirth, and high rates of HIV and AIDS infections. HIV means human immunodeficiency virus; AIDS means acquired immunodeficiency syndrome.
Further challenges include physical and mental disabilities, drug abuse, alcoholism and juvenile delinquency, meaning unlawful behaviour among young people. These concerns call for guidance that channels young people's talents and supports their development.
These concerns explain the importance of education and suitable guidance. They describe social challenges affecting this age group; they do not mean that every adolescent experiences each problem.
How do youth and skill policies respond?
The National Youth Policy, 2014, launched in February 2014, defines youth as persons aged 15 to 29 years. Its vision is to empower young people to fulfil their potential and, through them, help India attain its rightful place among nations.
The National Policy for Skill Development and Entrepreneurship, 2015 provides an umbrella framework for skilling activities. It seeks common standards and links training with demand centres. Entrepreneurship concerns undertaking and developing an enterprise.
Note: Adolescents aged 10 to 19 and youth aged 15 to 29 are overlapping categories with different age limits. They should not be used as interchangeable labels.
How does rural and urban composition vary across India?
Rural-urban composition groups people by residence in villages or urban areas. It is an important indicator of social and economic characteristics. About 68.8 per cent of India's population lived in villages in 2011, while the urban proportion was 31.16 per cent.
| Rural population indicator, 2011 | Value |
|---|---|
| Total villages | 640,867 |
| Inhabited villages | 597,608 |
| Inhabited share of all villages | 93.2 per cent |
Where are rural shares and village sizes different?
Himachal Pradesh and Bihar have very high rural percentages. Goa and Mizoram have only a little over half their population in villages. Union Territories have smaller rural proportions, except Dadra and Nagar Haveli, with 53.38 per cent.
Village size also varies considerably. It is less than 200 persons in the hill states of north-eastern India, western Rajasthan and the Rann of Kuchchh, but as high as 17,000 in Kerala and parts of Maharashtra.
Within states and between states, the relative degree of urbanisation and the extent of rural-urban migration regulate rural concentrations. A state's rural share and the number of people in an individual village describe different aspects of settlement.
Why has the urban population grown faster?
The urban share is quite low, but urban population shows a much faster rate of growth over the decades. Enhanced economic development and improved health and hygienic conditions have accelerated this growth.
In almost all states and Union Territories, urban population has increased considerably. This indicates improved socio-economic conditions in urban areas and increased rural-urban migration. Such movement is conspicuous along main roads and railways in the North Indian Plains.
Industrial areas around Kolkata, Mumbai, Bengaluru and Mysuru, Madurai and Coimbatore, Ahmedabad and Surat, Delhi and Kanpur, and Ludhiana and Jalandhar also show conspicuous migration. Transport links and industrial development help explain these concentrations.
Urbanisation remains low in agriculturally stagnant parts of the middle and lower Ganga Plains, Telangana and non-irrigated western Rajasthan. Remote hilly and tribal north-eastern areas, flood-prone Peninsular areas and eastern Madhya Pradesh also have low urbanisation.
What does linguistic composition reveal about India's diversity?
Linguistic composition groups a population by the languages its people speak. India has considerable linguistic diversity. Grierson's Linguistic Survey of India, conducted during 1903 to 1928, identified 179 languages and as many as 544 dialects, or varieties of language.
Modern India has about 22 scheduled languages, meaning languages listed in the Constitution's Eighth Schedule, and a number of non-scheduled languages. Among scheduled languages, Hindi speakers have the highest percentage. Sanskrit, Bodo and Manipuri speakers form the smallest groups in the 2011 comparison.
How are major languages grouped?
A language family groups related languages. The speakers of major Indian languages belong to four families, with further sub-families, branches and groups. These classifications organise diversity without making each language region a sharply bounded territory.
| Language family | Alternative name | Illustrative branches or speech areas |
|---|---|---|
| Austric | Nishada | Mon-Khmer in Meghalaya and the Nicobar Islands; Munda across several eastern and central states |
| Dravidian | Dravida | South Dravidian in Tamil Nadu, Karnataka and Kerala; also Central and North Dravidian groups |
| Sino-Tibetan | Kirata | Tibeto-Himalayan in Jammu and Kashmir, Himachal Pradesh and Sikkim; North Assam in Arunachal Pradesh |
| Indo-European | Aryan | Includes the Indo-Aryan branch across a wide area of northern, western and eastern India |
Linguistic frontiers, or the zones where language regions meet, do not have sharp and distinct boundaries. Instead, language regions gradually merge and overlap in their frontier zones. Language composition therefore reveals both diversity and contact between neighbouring regions.
The distinction between a language, a family and a speech area matters. Hindi is a language; Indo-European is a family; a speech area identifies the places where a particular group of speakers is found.
How are religious communities distributed and reflected in the landscape?
Religious composition describes a population in terms of its religious communities. Religion is one of the most dominant influences on the cultural and political life of the majority of Indians, extending into almost all aspects of family and community life.
The distribution is uneven. A community can have a large numerical presence in certain states or districts and be very negligibly represented in others. National shares should therefore be read alongside the geographical concentration of different communities.
| Religious group, 2011 | Population in million | Percentage of total |
|---|---|---|
| Hindus | 966.3 | 79.8 |
| Muslims | 172.2 | 14.2 |
| Christians | 27.8 | 2.3 |
| Sikhs | 20.8 | 1.7 |
| Buddhists | 8.4 | 0.7 |
| Jains | 4.5 | 0.4 |
| Other religions and persuasions | 7.9 | 0.7 |
| Religion not stated | 2.9 | 0.2 |
What are the major spatial patterns?
Hindus form a major group in many states, with shares ranging from 70 to 90 per cent and above. Exceptions include districts along the India-Bangladesh and India-Pakistan borders, Jammu and Kashmir, north-eastern hill states, and scattered Deccan Plateau and Ganga Plain areas.
Muslims, the largest religious minority, are concentrated in Jammu and Kashmir, certain districts of West Bengal and Kerala, many Uttar Pradesh districts, in and around Delhi, and Lakshadweep. They form a majority in the Kashmir valley and Lakshadweep.
Christians are distributed mostly in rural areas. Major concentrations occur around Goa and Kerala on the western coast, Meghalaya, Mizoram, Nagaland, the Chotanagpur area and the hills of Manipur. Sikhs are mostly concentrated in Punjab, Haryana and Delhi.
Jains have major concentrations in urban Rajasthan, Gujarat and Maharashtra. Buddhists are concentrated mostly in Maharashtra; other areas of Buddhist majority include Sikkim, Arunachal Pradesh, Ladakh, Tripura, and Lahul and Spiti in Himachal Pradesh.
Other religions include Zoroastrians and tribal and other indigenous faiths and beliefs. These groups occur in small pockets scattered throughout the country. Their geographical spread differs from that of communities concentrated across larger areas.
How does religion shape visible places?
Religious landscapes include sacred structures, cemeteries, plants, animals and groves used for religious purposes. Village shrines, temples, masjids, gurudwaras, monasteries and churches vary in size, form, use of space and density, giving places distinctive visible characteristics.
What do work participation and occupational composition show?
Work participation rate is the proportion of the population that works. Economic status divides the population into main workers, marginal workers and non-workers. In 2011, main and marginal workers together represented 39.8 per cent, leaving about 60 per cent as non-workers.
Definition: A main worker works for at least 183 days, or six months, in a year. A marginal worker works for less than 183 days, or six months, in a year. Non-workers do not undertake such economic work.
The large non-working share indicates a larger dependent population and the possible existence of many unemployed or underemployed people. Unemployed people lack employment; underemployed people have insufficient employment. Non-worker status alone should not be treated as proof of unemployment.
Why does participation differ across places?
Work participation ranges from about 29.1 per cent in Lakshadweep to about 51.9 per cent in Himachal Pradesh. Larger worker percentages occur in Himachal Pradesh, Sikkim, Chhattisgarh, Andhra Pradesh, Karnataka, Arunachal Pradesh, Nagaland, Manipur and Meghalaya.
Among Union Territories, Dadra and Nagar Haveli and Daman and Diu have higher participation. In India, participation tends to be higher in less economically developed areas because subsistence or near-subsistence activities, directed mainly towards meeting basic needs, require many manual workers.
How is the workforce divided by occupation?
Occupational composition concerns people's engagement in farming, manufacturing, trade, services or professional activities. The 2011 Census groups workers into cultivators, agricultural labourers, household industrial workers and other workers. Household industrial workers undertake household industry; other workers include non-household industry and services.
| Occupational grouping, 2011 | Share of all workers | Activities included |
|---|---|---|
| Cultivators and agricultural labourers | 54.6 per cent | Cultivation and agricultural labour |
| Household industrial workers | 3.8 per cent | Household industries |
| Other workers | 41.6 per cent | Non-household industries, trade, commerce, construction, repair and other services |
Agriculture accounts for the largest share. Male workers outnumber female workers in all three sectoral groups. Female workers are relatively numerous in the primary sector, represented here by agriculture, though there has been some recent improvement in women's participation in secondary and tertiary activities.
Secondary activities concern manufacturing and processing; tertiary activities concern services. Agricultural workers declined as a share of all workers from 58.2 per cent in 2001 to 54.6 per cent in 2011, alongside increased participation in secondary and tertiary sectors.
What the figure shows
India's occupational structure, 2011
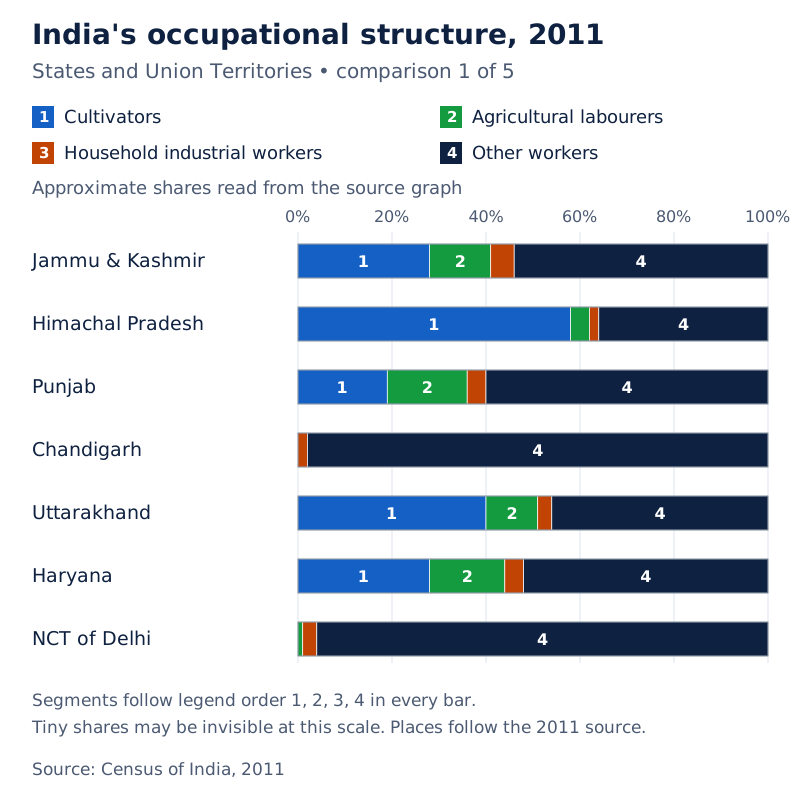
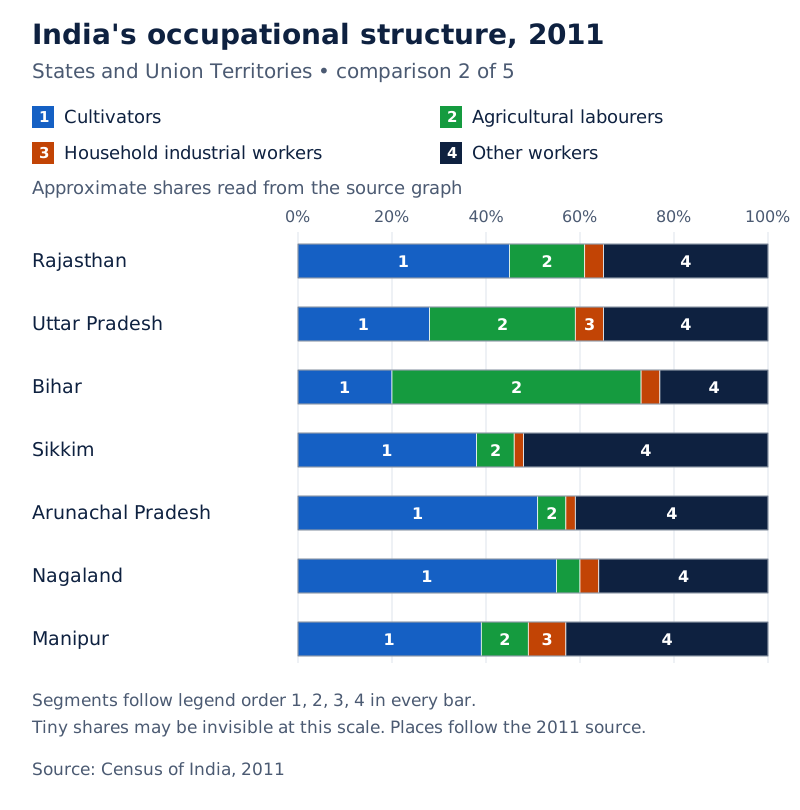
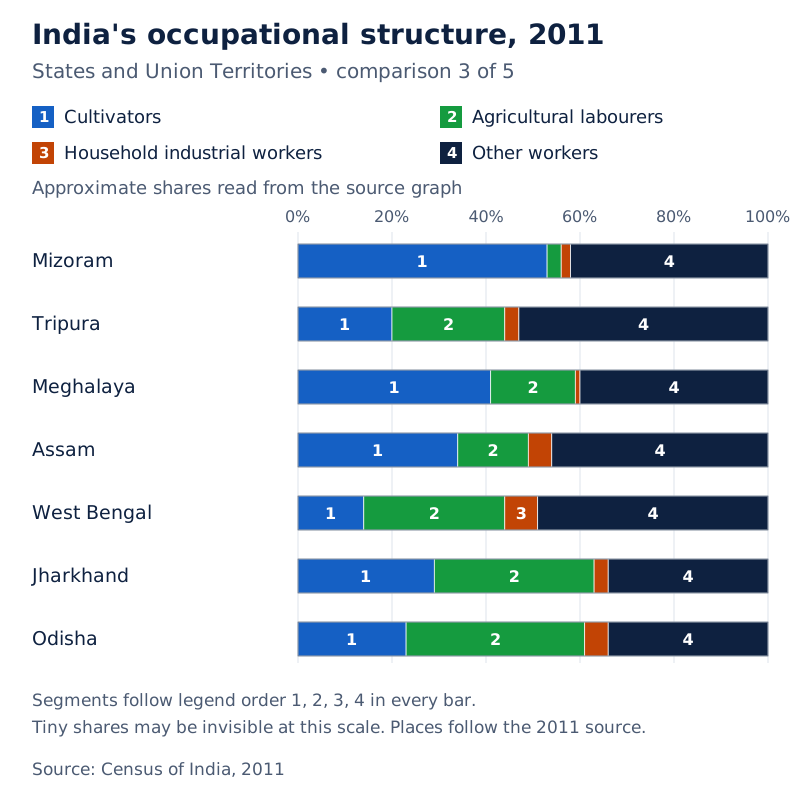
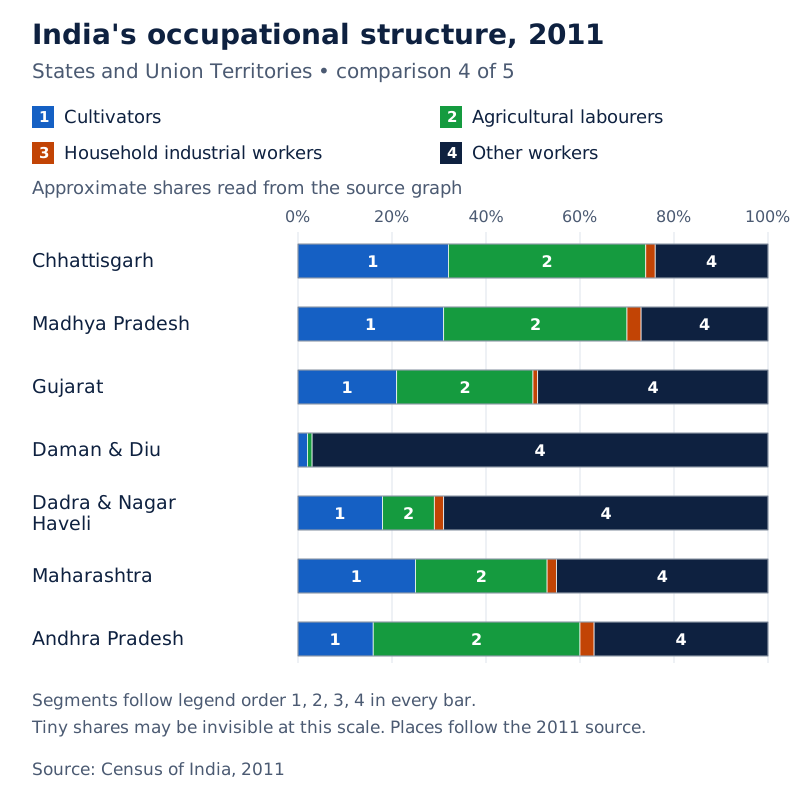
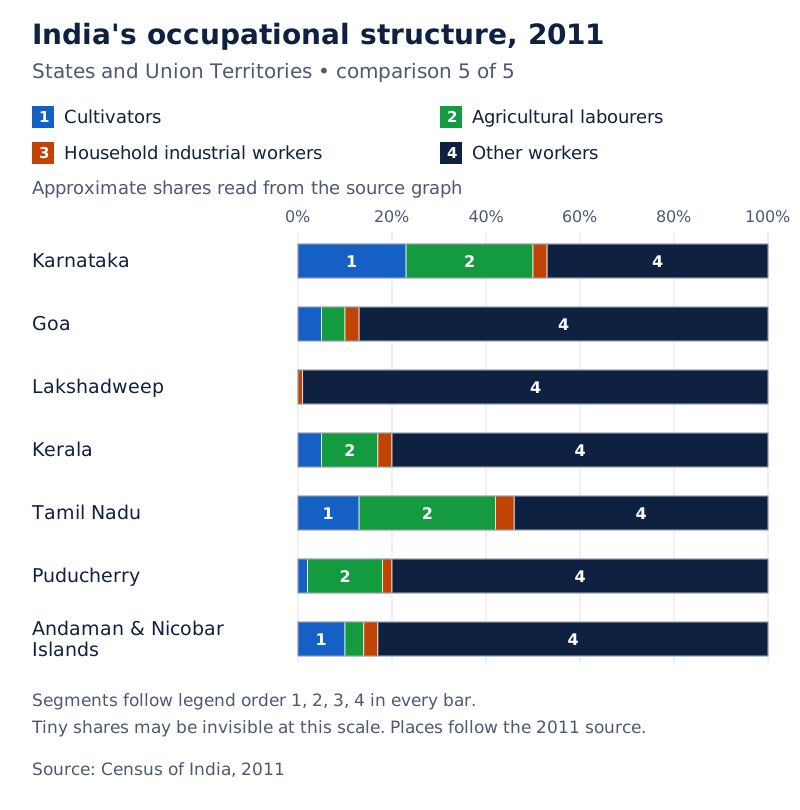
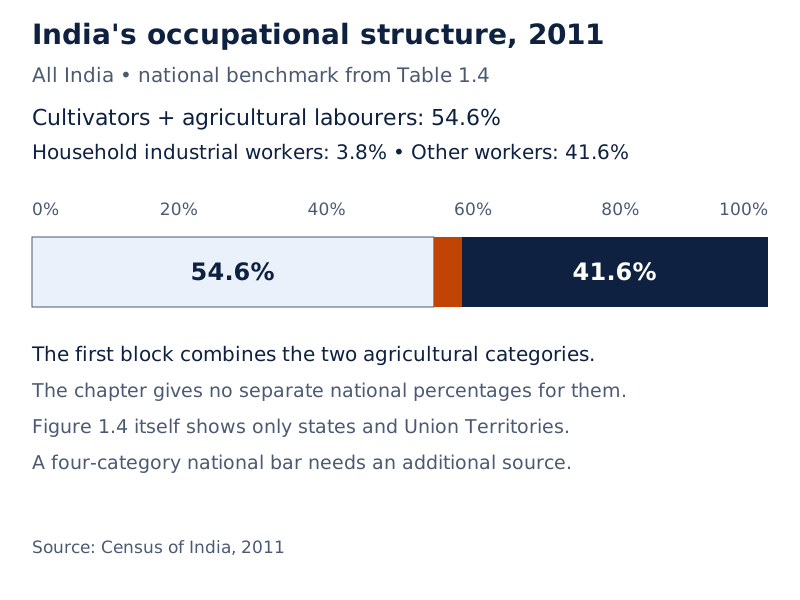
A stacked percentage bar chart compares states, Union Territories and all India. Its legend separates cultivators, agricultural labourers, household industrial workers and other workers.
Drawn by One Young India. See Fig. 1.4 in your NCERT textbook
Himachal Pradesh and Nagaland have very large cultivator shares. Bihar, Andhra Pradesh, Chhattisgarh, Odisha, Jharkhand, West Bengal and Madhya Pradesh have higher agricultural labourer proportions. Delhi, Chandigarh and Puducherry have very large proportions in other services, reflecting limited farming land and urbanisation and industrialisation.
Why is gender sensitivity important for population and development?
Gender sensitivity involves recognising and addressing disadvantages associated with gender. Divisions among male, female and transgender people are believed to be natural and biological, but social institutions also assign and reinforce roles. Biological differences can consequently become grounds for discrimination and exclusion.
Social constructs are meanings and roles shaped by society. The important connection is between such assigned roles and unequal opportunities. Excluding over half the population becomes a serious handicap for a developing and civilised society.
Which inequalities require attention?
Discrimination includes denied opportunities in education and employment, inadequate political representation, low wages for similar work and disregard for people's entitlement to a dignified life. Addressing these problems requires effective measures, rather than merely recognising differences between groups.
The nationwide Beti Bachao-Beti Padhao social campaign acknowledges the adverse effects of gender discrimination. Gender sensitivity connects population study with the opportunities people receive and the conditions in which they live, work and participate in society.
Working-population figures and gender sensitivity address related questions. Occupational data show differences in participation, while attention to discrimination examines denial of opportunities, unequal treatment and exclusion. A population's contribution to development depends on more than its numerical size.
Glossary
- Population distribution — The pattern showing how people are spread across different parts of an area.
- Population density — The number of persons living per unit area, commonly expressed per square kilometre.
- Physiological density — Total population divided by net cultivated area, relating all people to cultivated land.
- Agricultural density — Total agricultural population divided by net cultivable area, focusing on the agricultural population's relationship with land.
- Agricultural population — Cultivators and agricultural labourers together with their family members, used in calculating agricultural density.
- Population growth — Change in the number of people in an area between two points in time.
- Natural growth — The component of population growth analysed through crude birth rates and crude death rates.
- Induced growth — The component of population change associated with inward and outward movement of people.
- Doubling time — The time a population takes to double at its current annual growth rate.
- Population composition — Characteristics of a population, including age, sex, residence, language, religion, education and occupation.
- Adolescents — People aged 10 to 19 years, forming about 20.9 per cent of India's population in 2011.
- Work participation rate — The proportion of the total population engaged in work, including main and marginal workers.
- Main worker — A person working for at least 183 days, or six months, in a year.
- Marginal worker — A person working for less than 183 days, or six months, in a year.
- Occupational composition — The distribution of workers across farming, manufacturing, trade, services and other professional activities.
Common errors and misconceptions
- Misconception: A state's population share and density are the same. Correct: Share relates its population to the national total; density relates people to land area.
- Misconception: Physiological and agricultural density use the same population. Correct: Physiological density uses total population; agricultural density uses agricultural population, including family members.
- Misconception: A slowing growth rate means population is falling. Correct: A positive rate still means growth, even when the rate becomes lower.
- Misconception: Kerala's 9.4 per cent growth describes 2001 to 2011. Correct: This figure refers to 1991 to 2001.
- Misconception: Every state and Union Territory recorded lower growth during 2001 to 2011. Correct: Almost all did; Tamil Nadu and Puducherry registered some increase.
- Misconception: Adolescents and youth have identical age limits. Correct: Adolescents are aged 10 to 19; the National Youth Policy defines youth as aged 15 to 29.
- Misconception: A high work participation rate proves high economic development. Correct: Participation tends to be higher in less developed areas requiring many manual workers for subsistence activities.
- Misconception: Other workers means service workers alone. Correct: This category also includes non-household industries, construction, repair, trade and commerce.
Exam-style questions with model answers
Q1. Main workers work for at least 183 days in a year; marginal workers work for less than 183 days. Explain the distinction using this threshold. [2 marks]
- A main worker works for at least 183 days in the year, including the threshold itself.
- A marginal worker works for fewer than 183 days, so the distinction concerns duration of work.
Q2. In 2011, Arunachal Pradesh had 17 persons per km², Bihar 1,102 and Delhi 11,297. Here km² means square kilometre. Compare these densities in three points. [3 marks]
- Arunachal Pradesh has the lowest density among the three areas, at 17 persons per square kilometre. This expresses population relative to land area.
- Bihar has a much higher density than Arunachal Pradesh, at 1,102 persons per square kilometre, showing a strong contrast between the two states.
- Delhi has the highest density among the three, at 11,297 persons per square kilometre. Its density exceeds both Bihar's and Arunachal Pradesh's.
Q3. Explain four reasons for India's uneven population distribution, referring to physical conditions, agriculture, settlement history and urban economic development. [4 marks]
- Climate, terrain and water availability largely determine distribution, helping explain higher population concentrations in river plains, deltas and coastal plains.
- The evolution of settled agriculture and subsequent agricultural development support population concentrations and contribute to differences between regions.
- An early history of settlement and developed transport networks help river plains and coastal regions retain large concentrations despite signs of resource degradation.
- Industrial development and urbanisation attract rural-urban migrants, helping create high population concentrations in major urban regions.
Q4. The growth phases are 1901 to 1921, 1921 to 1951, 1951 to 1981 and after 1981. Explain these four phases and distinguish slower growth from population decline. [5 marks]
- During 1901 to 1921, growth was stagnant or stationary. High birth and death rates kept the increase low, with poor health services and inefficient distribution of necessities contributing to these conditions.
- During 1921 to 1951, growth became steady. Health and sanitation improvements lowered mortality, transport improved distribution, and the crude birth rate remained high.
- During 1951 to 1981, a population explosion occurred. Mortality fell rapidly while fertility stayed high; improved living conditions and increased international migration also contributed.
- After 1981, growth remained high but began slowing gradually. Falling birth rates were associated with increased mean marriage age and improved quality of life, particularly female education.
- Slower growth means the rate of increase has fallen. If that rate remains positive, the population continues increasing rather than declining.
Q5. In 2011, cultivators and agricultural labourers formed 54.6 per cent of workers, household industrial workers 3.8 per cent, and other workers 41.6 per cent. The agricultural share was 58.2 per cent in 2001. Using these data and the occupational categories, explain India's workforce composition in five points. [5 marks]
- Cultivators and agricultural labourers together accounted for 54.6 per cent of all workers in 2011. Agriculture therefore employed more than half the working population.
- Household industrial workers formed 3.8 per cent. Their share was much smaller than either the agricultural grouping or the other-workers grouping.
- Other workers represented 41.6 per cent. This group includes non-household industries, trade, commerce, construction, repair and other services, so it is not limited to services.
- The agricultural share declined from 58.2 per cent in 2001 to 54.6 per cent in 2011. These figures describe shares of workers, not shares of the whole population.
- The declining agricultural share indicates a shift in dependence from farm-based to non-farm occupations, alongside increased participation in secondary and tertiary sectors.
Q6. Adolescents aged 10 to 19 formed about 20.9 per cent of India's population in 2011. Among adolescents, 52.7 per cent were male and 47.3 per cent female. Interpret these three percentages. [3 marks]
- About 20.9 per cent expresses the adolescent population as a share of India's total population. The age range for this group is 10 to 19 years.
- The male share of 52.7 per cent refers to the adolescent population alone. It does not mean that male adolescents formed this share of all Indians.
- The female share of 47.3 per cent also uses adolescents as its base. It is smaller than the male share within that age group.
Q7. Between 1991 to 2001 and 2001 to 2011, growth rates fell by 3.5 percentage points in Andhra Pradesh and 6.7 in Maharashtra; they rose by 3.9 in Tamil Nadu and 7.1 in Puducherry. Compare the changes in four points. [4 marks]
- Andhra Pradesh recorded a fall of 3.5 percentage points, meaning its growth rate was lower in the later decade.
- Maharashtra's fall was 6.7 percentage points, a larger reduction in growth rate than the decline in Andhra Pradesh.
- Tamil Nadu recorded an increase of 3.9 percentage points, contrasting with the declining rates in the first two states.
- Puducherry's increase was 7.1 percentage points, greater than Tamil Nadu's increase. These two cases prevent a claim that growth rates fell everywhere.
Q8. State two forms of gender discrimination affecting opportunities and treatment in society. [2 marks]
- People may be denied opportunities in education, employment or political representation because of gender.
- They may receive low wages for similar work or be denied treatment consistent with a dignified life.
Key takeaways
- India's population distribution reflects climate, terrain, water, agricultural development, settlement history, transport, industrialisation and urbanisation acting together.
- Density measures people per unit area, while physiological and agricultural densities focus more specifically on relationships with agricultural land.
- Population growth has natural and induced components, involving births and deaths as well as inward and outward migration.
- The four growth phases move from stagnation through steady growth and population explosion to high but gradually slowing growth.
- Regional growth comparisons need their dates: almost all states and Union Territories slowed during 2001 to 2011, with exceptions.
- Population composition includes rural and urban residence, language, religion and occupation, alongside other social and demographic characteristics.
- Agriculture employed 54.6 per cent of workers in 2011, while its declining share indicated a shift towards non-farm work.
- Adolescent guidance, youth development and gender sensitivity connect population characteristics with education, employment, opportunity and a dignified life.
Test yourself
How do India's first Census and first complete Census differ in date?
The first population Census was conducted in 1872; the first complete Census followed in 1881.
Which four states lead the population ranking used here?
Uttar Pradesh leads, followed by Maharashtra, Bihar and West Bengal.
Who is included in the agricultural population?
It includes cultivators, agricultural labourers and their family members.
What does population doubling time mean?
It is the time required for a population to double at its current annual growth rate.
Which decade in the stagnant phase recorded negative growth?
The decade from 1911 to 1921 recorded negative population growth.
How do linguistic regions meet at their frontiers?
They gradually merge and overlap rather than having sharp and distinct boundaries.
What are the four Census occupational categories?
They are cultivators, agricultural labourers, household industrial workers and other workers.
Why can work participation be high in less developed areas?
Subsistence or near-subsistence economic activities require many manual workers, so participation tends to be higher.
Write about it
Turn a question from this chapter into a paper.
The Writing Studio has a structure guide, a rubric and citation tools for 15 formats, from essays to research papers. Drafting is free with an account. Learnacy Essential adds feedback from an AI writing coach and submission to The OYI Review.
Learnacy Essential is ₹1,499 for the year. Publication depends on review and is not guaranteed.