
Comparative Development Experiences of India and its Neighbours | CBSE Class 12 Economics Notes
On this page
Try an idea before you read. Test your understanding of the development paths of India, China, and Pakistan. Explore →
This note covers the development paths of India, China and Pakistan, planning and economic reforms, population indicators, output and employment, human development, political liberty, the appraisal of development strategies, and trade comparisons.
Why compare the development experiences of India and its neighbours?
What makes comparison useful?
Development strategies are the policies and institutional arrangements used to improve an economy and its people's living conditions. Comparing neighbouring countries helps identify domestic strengths and weaknesses, particularly when developing countries compete within relatively limited world markets.
Globalisation, the growing integration of economies, has both short-term and long-term implications. Countries form regional and global economic groupings to strengthen their domestic economies. Common economic activities also affect human development across a shared regional environment.
India, China and Pakistan provide a useful comparison because their modern development journeys began around the same time. India and Pakistan became independent in 1947, while the People's Republic of China was established in 1949.
How were their starting strategies similar?
All three adopted planning, meaning an organised approach to development through stated objectives and policies. Their political systems and the structures implementing these policies differed. India and Pakistan both created large public sectors, meaning government-owned enterprises, and increased public expenditure on social development.
| Planning milestone | India | China | Pakistan |
|---|---|---|---|
| First Five Year Plan | 1951 to 1956 | 1953 | 1956 |
| Later planning milestone | Five Year Plan model followed until March 2017 | Fourteenth Five Year Plan, 2021 to 2025 | Twelfth Five Year Development Plan, 2018 to 2023 |
| Beginning of economic reforms | 1991 | 1978 | 1988 |
Until the 1980s, the three countries had similar growth rates and per capita incomes, meaning incomes per person. Their later experiences diverged, making it necessary to compare both the policies adopted and the outcomes achieved.
India's democratic institutions form an important part of this comparison. China's development began under one-party rule, while political instability features prominently in explanations of Pakistan's performance. Economic outcomes therefore need to be considered alongside institutions and people's freedoms.
How did China pursue development before the 1978 reforms?
What were government control and communes?
After the People's Republic of China was established, critical sectors, enterprises and individually owned land were brought under government control. This created a command economy, in which the government directed major economic activities.
The Great Leap Forward (GLF) campaign began in 1958 to industrialise China on a massive scale. People were encouraged to establish industries in their backyards. In rural areas, communes organised agricultural production.
Definition: Under the commune system, people collectively cultivated land. In 1958, China had 26,000 communes covering almost all the farm population.
The campaign encountered serious problems. A severe drought caused havoc, killing about 30 million people. Following conflicts with China, Russia withdrew professionals who had been helping the industrialisation process.
In 1965, Mao introduced the Great Proletarian Cultural Revolution, associated with the period 1966 to 1976. Students and professionals were sent to work and learn in the countryside.
Why did the leadership seek a change?
The new leadership was dissatisfied with slow growth and the lack of modernisation under Maoist rule. It felt that decentralisation, self-sufficiency and the rejection of foreign technology, goods and capital had failed to deliver the desired development.
Despite extensive land reforms, collectivisation and the Great Leap Forward, per capita grain output, or grain output per person, was the same in 1978 as in the mid-1950s. This was an important sign of the limitations of earlier policies.
However, the pre-reform period also established useful foundations. Education and health infrastructure, land reforms, small enterprises and decentralised planning helped later improvements in social and income indicators. Basic health services had already expanded substantially in rural areas.
The commune system also supported a more equitable distribution of foodgrains. An appraisal therefore needs to consider both disappointing production outcomes and the social foundations that supported subsequent reforms.
How did China's phased reforms change incentives and production?
What changed in agriculture and industry?
China introduced reforms in 1978. The initial phase covered agriculture, foreign trade and investment. Later reforms extended to industry. The agricultural changes illustrate how incentives could change while collective ownership remained.
- Commune land was divided into small plots and allocated to individual households for cultivation.
- Households received the right to use the land, not ownership of it.
- After paying stipulated taxes, households could retain all income earned from the land.
- The resulting prosperity among a vast number of poor people created conditions for rural industrial growth and support for further reforms.
The private sector consists of enterprises owned outside government. Private firms were allowed to produce goods. Township and village enterprises, owned and operated by local collectives, were particularly important. State Owned Enterprises (SOEs), meaning government-owned enterprises, were made to face competition.
How did dual pricing work?
Definition: Dual pricing used government-fixed prices for specified quantities of inputs and outputs, while the remaining quantities were purchased and sold at market prices.
Both farmers and industrial units operated under this arrangement. As production increased over the years, the proportion of goods and inputs transacted at market prices also increased. Thus, the reform process expanded the role of market transactions.
Special economic zones, designated areas intended to attract foreign investors, were established. These measures connected changes in domestic production with the opening of foreign trade and investment.
Why did the method of implementation matter?
Experts point out that each reform measure was first tried on a smaller scale before wider implementation. Experimentation under decentralised government allowed the economic, social and political costs of success or failure to be assessed.
China introduced structural reforms on its own initiative. Its leadership's dissatisfaction with earlier outcomes differed from the pressures exerted by international agencies on India and Pakistan. This distinction helps explain the different circumstances in which reforms began.
Note: Allocating land for household cultivation did not transfer ownership to households. Collective ownership continued, and this arrangement helped ensure social security in rural areas.
What development policies did Pakistan adopt?
How did the policy direction change?
Pakistan followed a mixed economy, in which public and private sectors coexist. Its early policies shared several features with India's, including planning, public investment and protection for domestic industry.
In the late 1950s and the 1960s, Pakistan pursued import substitution, meaning the encouragement of domestic production in place of imports. Its policy combined tariff protection, or import duties protecting domestic producers, with direct controls on competing imports of manufactured consumer goods.
The Green Revolution, involving changes in agricultural technology, brought mechanisation and increased public investment in infrastructure in select areas. Foodgrain production rose, and the agrarian structure changed dramatically.
Nationalisation means bringing enterprises under government ownership. Capital goods industries produce goods used in further production. Denationalisation reverses government ownership. Private-sector incentives encourage enterprises outside government.
| Period | Policy or development |
|---|---|
| Late 1950s and 1960s | Regulated framework for import substitution, tariff protection and direct import controls |
| 1970s | Nationalisation of capital goods industries |
| Late 1970s and 1980s | Denationalisation and encouragement of private enterprise |
| 1988 | Economic reforms initiated |
What supported investment and growth?
Pakistan received financial support from western nations and remittances, meaning money sent home by workers abroad. Increasing migration to the Middle East enlarged this source of funds. These inflows helped stimulate economic growth.
The government also offered incentives to private enterprise, creating conditions favourable to new investment. However, reliance on remittances and foreign support later became important in explaining the economy's vulnerability.
Photograph: Wagah Border (NCERT Figure 8.1). The photograph shows spectators, uniformed personnel, gates and flags at the border. Wagah Border serves both as a tourist location and a trading point between India and Pakistan.
How do the demographic indicators of the three countries compare?
What do the measures mean?
Demographic indicators describe population characteristics. Population density means people per square kilometre. The sex ratio here means females per 1,000 males. Fertility rate describes average births per woman, while urbanisation measures the proportion of people living in urban areas.
The following figures relate to 2021 to 2023. Population is measured in millions. Annual growth and urbanisation are percentages, meaning amounts per hundred; a negative population growth rate indicates a declining population.
| Indicator | India | China | Pakistan |
|---|---|---|---|
| Estimated population, million | 1428 | 1411 | 240 |
| Annual population growth, per cent | 0.81 | −0.10 | 1.96 |
| Density, people per square kilometre | 473 | 150 | 300 |
| Sex ratio, females per 1,000 males | 930 | 898 | 948 |
| Fertility rate, births per woman | 2.0 | 1.2 | 3.4 |
| Urbanisation, per cent | 36 | 65 | 38 |
Pakistan has the highest population growth and fertility rates. China has the lowest density despite occupying the largest geographical area among the three. China's urban population share is highest, while India's is lowest.
What were the effects of the one-child norm?
Scholars identify China's one-child norm, introduced in the late 1970s to limit couples to one child, as the major reason for low population growth. They also state that it led to a decline in the sex ratio.
Sex ratios are low and biased against females in all three countries. Scholars cite son preference, the preference for male children, as the reason. All three countries have adopted measures to improve the situation.
Restricting population growth also changes the age structure. After a few decades, China would have more elderly people in proportion to young people. This implication led China to allow couples to have two children.
Diagram
Urbanisation comparison
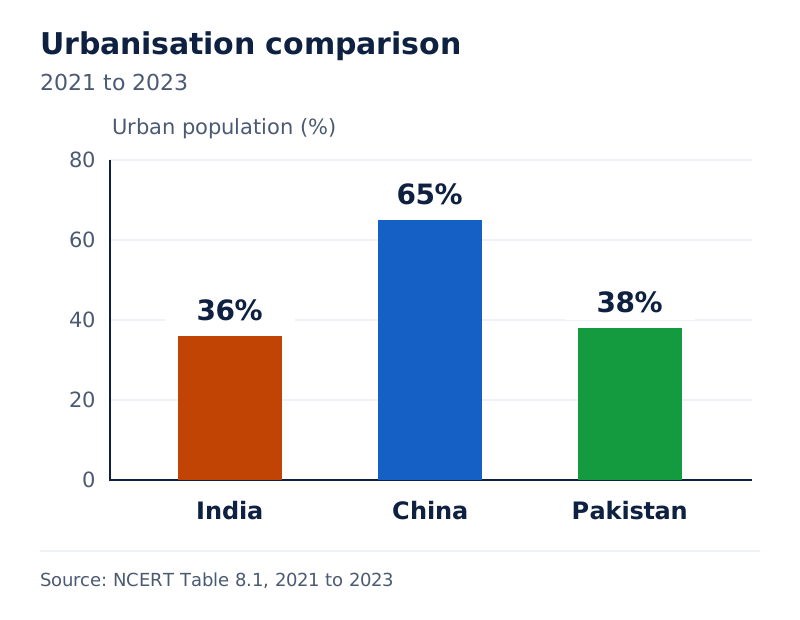
Draw three bars labelled India, China and Pakistan, with urban population percentage on the vertical axis. Use heights of 36, 65 and 38 respectively, and label the period 2021 to 2023.
Drawn by One Young India.
How do economic size and growth rates differ?
What is being compared?
Gross Domestic Product (GDP) measures the value of final goods and services produced within an economy. Purchasing power parity (PPP) allows comparison after accounting for differences in purchasing power. Economic size and the rate of growth are different measures.
China's GDP at PPP is $35 trillion, compared with India's $15 trillion and Pakistan's $1.5 trillion. Here, $ means US dollars, and a trillion is a million million. China's economy is the second largest in the world on this measure.
Pakistan's GDP is roughly about 10 per cent of India's. These are comparisons of the level of output. By contrast, a growth rate describes how rapidly output increases over time.
| Country | Annual GDP growth, 1980 to 1990, per cent | Annual GDP growth, 2015 to 2017, per cent | Annual GDP growth, 2024, per cent |
|---|---|---|---|
| India | 5.7 | 7.3 | 6.5 |
| China | 10.3 | 6.8 | 5.0 |
| Pakistan | 6.3 | 5.3 | 3.1 |
How should these figures be interpreted?
During the 1980s, China recorded near double-digit growth while many developed countries struggled to maintain even 5 per cent. Pakistan's growth exceeded India's in that period. The ranking changed in the later observations, with India recording the highest rate.
India's 2024 rate is above its 1980 to 1990 rate but below its 2015 to 2017 rate. China and Pakistan show lower rates in each successive column. A comparison must therefore specify which periods it uses.
Diagram
Annual GDP growth in 2024
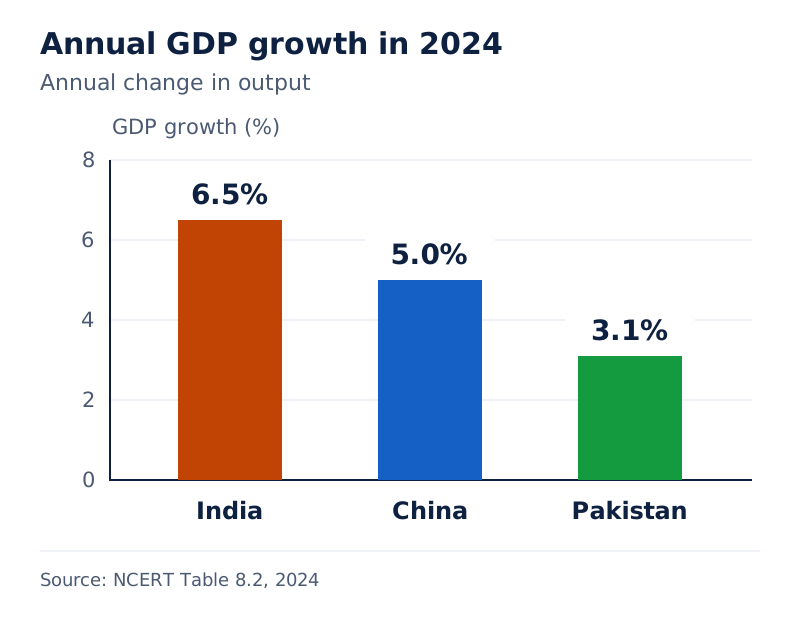
Draw country bars with growth in per cent on the vertical axis. Use India 6.5, China 5.0 and Pakistan 3.1. These bars compare growth rates, not the total sizes of the economies.
Drawn by One Young India.
What do sectoral output and employment reveal about development?
How are output shares different from workforce shares?
Gross Value Added (GVA) is the value of output less the value of intermediate inputs used in producing it. A sector's GVA share measures its contribution to total value added. Its workforce share measures the proportion of workers employed there.
The three sectors compared are agriculture, industry and services. Services include activities such as commerce and transport. Manufacturing, or producing goods, forms part of industry. The figures below show sectoral shares for 2022, all in per cent.
| Sector and measure | India | China | Pakistan |
|---|---|---|---|
| Agriculture: GVA share | 18 | 8 | 24 |
| Agriculture: workforce share | 43 | 23 | 36 |
| Industry: GVA share | 28 | 38 | 21 |
| Industry: workforce share | 26 | 32 | 26 |
| Services: GVA share | 54 | 54 | 55 |
| Services: workforce share | 31 | 45 | 38 |
Agriculture employs a larger share of workers than its GVA contribution in every country. India's agricultural workforce share is highest, while China's is lowest. Services contribute the largest GVA share in all three economies.
How have the development paths differed?
In the normal course of development, employment and output shift from agriculture to industry and then to services. China has followed this pattern. India and Pakistan have shifted directly towards services, with industry playing a smaller role.
China's topographic and climatic conditions limit land suitable for cultivation to only about 10 per cent of its total area. Its cultivable area is 40 per cent of India's. Until the 1980s, more than 80 per cent of China's people depended solely on farming.
The government subsequently encouraged activities such as handicrafts, commerce and transport. Service employment shares rose from 17, 12 and 27 per cent in the 1980s to 31, 45 and 38 per cent in 2022 for India, China and Pakistan respectively.
What the figure shows
Land use and agriculture
This map labels India, China and Pakistan and is marked “Not to scale”. Its key identifies cattle, goats, cotton, fishing, jute, rice and tea through symbols.
See Fig. 8.2 in your NCERT textbook
What the figure shows
Industry
This map of India, China and Pakistan is marked “Not to scale”. The key identifies car/vehicle manufacture, cement, chemicals, coal, electronics, engineering, finance, food processing, oil and gas, textiles, and iron and steel.
See Fig. 8.3 in your NCERT textbook
How have growth rates within sectors changed?
What does the comparison of periods show?
A sectoral growth rate describes how quickly a sector's output grows. It differs from the sector's share of total output. Comparing these measures separately helps explain whether development is being driven mainly by agriculture, industry or services.
The following table compares output growth in 1980 to 1990 with 2014 to 2018. All entries are growth rates in per cent. The two periods should be kept distinct from the 2022 sectoral shares.
| Country and sector | 1980 to 1990 | 2014 to 2018 |
|---|---|---|
| India: agriculture | 3.1 | 3.1 |
| India: industry | 7.4 | 6.9 |
| India: services | 6.9 | 7.6 |
| China: agriculture | 5.9 | 3.1 |
| China: industry | 10.8 | 5.3 |
| China: services | 13.5 | 7.1 |
| Pakistan: agriculture | 4.0 | 1.7 |
| Pakistan: industry | 7.7 | 4.8 |
| Pakistan: services | 6.8 | 5.0 |
China's industrial and service sectors recorded high growth in the earlier period. Both rates were lower in 2014 to 2018. India's service growth increased, its industrial growth declined, and its agricultural growth remained at 3.1 per cent.
Pakistan experienced deceleration, meaning a slowing of growth, in all three sectors. Its agricultural rate fell from 4.0 to 1.7 per cent, industrial growth from 7.7 to 4.8 per cent, and service growth from 6.8 to 5.0 per cent.
Manufacturing and services have contributed to China's growth, whereas services have been especially important for India. The comparison also shows why a single aggregate growth rate cannot explain every change within an economy.
Note: Slower positive growth does not mean falling output. It means output is still increasing, but at a lower rate. Keep growth rates separate from the percentage distribution of output or workers.
How do human development and liberty broaden the comparison?
What do the social indicators show?
Human development concerns people's living conditions and opportunities, including health, education and income. The Human Development Index (HDI) combines these broad dimensions. Its value and rank should be considered alongside specific indicators rather than treated as a complete description of welfare.
Life expectancy at birth means the years a newborn is expected to live under prevailing mortality conditions. Infant mortality measures deaths before the first birthday per 1,000 live births. Maternal mortality here records maternal deaths per one lakh births; one lakh means 100,000.
Mean years of schooling describes the average years of education completed by the specified population. The schooling figures below refer to people aged 15 and above.
Gross National Income (GNI) per capita means national income per person. The income figures use PPP US dollars. Undernourishment refers to insufficient dietary energy intake, while sanitation concerns facilities for safe disposal of human waste.
| Selected indicator, 2017 to 2023 | India | China | Pakistan |
|---|---|---|---|
| HDI value | 0.685 | 0.797 | 0.544 |
| HDI rank | 130 | 78 | 168 |
| Life expectancy at birth, years | 72.0 | 78.0 | 67.6 |
| Mean years of schooling, aged 15 and above | 6.9 | 8.0 | 4.3 |
| GNI per capita, PPP US dollars | 9,047 | 22,029 | 5,501 |
| Below national poverty line, per cent | 21.9, 2019 to 2021 | 0.0, 2023 | 21.9, 2023 |
| Infant mortality, per 1,000 live births | 25.5 | 4.8 | 51 |
| Maternal mortality, per one lakh births | 103 | 23 | 154 |
| At least basic sanitation, per cent of population | 78 | 96 | 71 |
| At least basic drinking water source, per cent of population | 93 | 98 | 91 |
| Undernourishment, per cent of population | 17 | 3 | 19 |
China is ahead on many indicators, with higher income and life expectancy and lower mortality and undernourishment. All three countries provide improved drinking water sources for most of their populations. The national poverty percentages have different reference years.
Why are liberty indicators necessary?
Liberty indicators assess freedoms and protections that income and health measures do not fully capture. They include democratic participation in social and political decision-making, constitutional protection of citizens' rights, judicial independence and the rule of law.
Judicial independence means courts can make decisions without improper interference. The rule of law concerns government and citizens being subject to law. These protections matter when judging development, particularly where political freedom and human rights are concerns.
A measure of democratic participation has been included without extra weight, while the specified constitutional protections have not been included. Without these, and perhaps some more, receiving overriding importance, the construction of a human development index may be said to be incomplete and its usefulness limited.
What explains the contrasting results of development strategies?
How did China combine earlier foundations with reform?
China's later achievements cannot be separated from earlier public intervention in education and health, land reforms, decentralised planning and small enterprises. These foundations helped improve social and income indicators after reform.
China used market mechanisms to create additional social and economic opportunities while retaining its political commitment. Collective land ownership combined with individual cultivation helped provide rural social security. Nevertheless, the lack of political freedom and its implications for human rights remain major concerns.
Why did Pakistan face slowing growth and renewed poverty?
Foreign exchange means foreign currencies used for international transactions. Volatile earnings fluctuate, making them a less stable basis for development.
Scholars using Pakistan's official data indicate that the proportion of poor people fell from more than 40 per cent in the 1960s to 25 per cent in the 1980s, before rising again in later decades.
- Agricultural growth and food supply depended on good harvests rather than an institutionalised process of technical change.
- When harvests were poor, economic indicators showed stagnation or negative trends.
- Most foreign exchange earnings came from workers' remittances from the Middle East and exports of highly volatile agricultural products.
- Dependence on foreign loans grew while repayment became more difficult.
Scholars also identify political instability and over-dependence on foreign aid as reasons for Pakistan's slowdown.
What evidence qualifies a wholly negative assessment?
Macroeconomic indicators describe the economy as a whole.
Pakistan also showed recovery. For 2017 to 2018, growth was 5.5 per cent for GDP, 4.9 per cent for industry and 6.2 per cent for services. Agricultural growth remained far from satisfactory, while many macroeconomic indicators began showing stable and positive trends.
This recovery evidence must remain tied to its period. It does not remove the earlier weaknesses or establish that every later indicator improved.
India, with democratic institutions, performed moderately and undertook initiatives to improve infrastructure and living standards. Its substantial agricultural workforce and human development challenges show why growth, employment, social provision and freedom all belong in a development comparison.
How can India's trade with its neighbours be compared numerically?
What information is needed?
Exports are goods and services sold abroad, while imports are purchases from abroad. To express exports as a percentage of imports, divide export value by import value and multiply by 100. Use the same currency unit and year for both values.
The following trade values are in Indian rupees, shown by ₹, and measured in crore; one crore means ten million. The country column identifies India's trading partner. The two years are 2004 to 2005 and 2024 to 2025.
| Partner | Exports, 2004 to 2005, ₹ crore | Imports, 2004 to 2005, ₹ crore | Exports, 2024 to 2025, ₹ crore | Imports, 2024 to 2025, ₹ crore |
|---|---|---|---|---|
| Pakistan | 2,341 | 427 | 4,720 | 4 |
| China | 25,232 | 31,892 | 1,20,617 | 9,59,666 |
The compound annual growth figures for exports to Pakistan and China were 3.6 and 8.1 per cent respectively; those for imports were −20.8 and approximately 18.6 per cent. Compound annual growth expresses change as an equivalent annual rate with compounding over the period.
Exports as a percentage of imports = (export value ÷ import value) × 100. The division sign ÷ means divide, the multiplication sign × means multiply, and % means per cent.
How are the four ratios calculated?
Worked example 1. For Pakistan in 2004 to 2005, India's exports were ₹2,341 crore and imports were ₹427 crore. Calculate exports as a percentage of imports.
Answer: (2,341 ÷ 427) × 100 = approximately 548.24%. Exports were greater than imports.
Worked example 2. For Pakistan in 2024 to 2025, India's exports were ₹4,720 crore and imports were ₹4 crore. Calculate exports as a percentage of imports.
Answer: (4,720 ÷ 4) × 100 = 118,000%. The very small import value produces a very large ratio.
Worked example 3. For China in 2004 to 2005, India's exports were ₹25,232 crore and imports were ₹31,892 crore. Calculate exports as a percentage of imports.
Answer: (25,232 ÷ 31,892) × 100 = approximately 79.12%. Exports were lower than imports.
Worked example 4. For China in 2024 to 2025, India's exports were ₹1,20,617 crore and imports were ₹9,59,666 crore. Calculate exports as a percentage of imports.
Answer: (1,20,617 ÷ 9,59,666) × 100 = approximately 12.57%. Exports were a smaller proportion of imports than in 2004 to 2005.
The ratio compares two trade flows within a year. It is not a growth rate over time. Pakistan's ratio rose sharply, while China's fell. These observations describe the values supplied; they do not by themselves establish why trade changed.
Glossary
- Mixed economy — An economy where public and private sectors coexist in economic activity.
- Commune — A collective arrangement in which people jointly cultivated agricultural land in China.
- Dual pricing — Government-fixed prices apply to specified quantities, while remaining quantities trade at market prices.
- State Owned Enterprise — An enterprise owned by the government, comparable to a public sector enterprise in India.
- Township and village enterprises — Enterprises owned and operated by local collectives, allowed to produce goods during China's reforms.
- Special economic zones — Designated areas established as part of China's reforms to attract foreign investors.
- Sex ratio — The number of females per one thousand males in the population.
- Urbanisation — The proportion of a country's population living in urban areas.
- Remittances — Money sent home by people working outside their own country.
- Import substitution — Encouraging domestic production of goods that would otherwise be imported.
- Gross Value Added — The value of output after deducting intermediate inputs used in production.
- Infant mortality rate — Deaths of infants before their first birthday per one thousand live births.
- Liberty indicators — Measures of democratic participation, constitutional rights, judicial independence and the rule of law.
- Deceleration — A slowing of the rate of growth rather than necessarily a fall in output.
Common errors and misconceptions
- Misconception: All three countries introduced reforms together. Correct: Their reform dates differ: China in 1978, Pakistan in 1988 and India in 1991.
- Misconception: Chinese agricultural reform gave households ownership of commune land. Correct: Households received plots for use, not ownership, and retained income after stipulated taxes.
- Misconception: Dual pricing means every transaction uses a market price. Correct: Specified quantities used government-fixed prices; the remaining quantities traded at market prices.
- Misconception: China's economic size means it must have the highest growth rate in every period. Correct: In 2024, India's growth was 6.5 per cent and China's was 5.0 per cent.
- Misconception: Agriculture's output share is the same as its employment share. Correct: In India in 2022, agriculture supplied 18 per cent of GVA but employed 43 per cent of the workforce.
- Misconception: A lower positive growth rate means output has fallen. Correct: Output still rises when growth is positive, although it increases more slowly.
- Misconception: Human development can be assessed completely from income and health. Correct: Liberty indicators, including democratic participation and constitutional protections, also need consideration.
- Misconception: Exports as a percentage of imports cannot exceed 100. Correct: The ratio exceeds 100 when export value exceeds import value; it is not a share of total trade.
Exam-style questions with model answers
Q1. Under China's agricultural reforms, households received small plots for use, not ownership, and could keep income after stipulated taxes. Identify two features of this arrangement. [2 marks]
- Land ownership was not transferred to households; they received the right to cultivate allocated plots.
- Households retained the income earned after paying stipulated taxes, giving them an incentive to increase production.
Q2. China began the Great Leap Forward in 1958, encouraged backyard industries and established rural communes. In that year, 26,000 communes covered almost all the farm population. Explain three features of this campaign using this information. [3 marks]
- The Great Leap Forward, initiated in 1958, aimed to industrialise China on a massive scale, making industrial expansion a central development objective.
- People were encouraged to set up industries in their backyards, making small production units part of the campaign for industrial expansion.
- Rural communes organised collective cultivation. The 26,000 communes in 1958 covered almost all the farm population, showing the extensive reach of the arrangement.
Q3. For 2021 to 2023, population growth rates were India 0.81%, China −0.10% and Pakistan 1.96%; urban population shares were 36%, 65% and 38%; fertility rates were 2.0, 1.2 and 3.4; and population densities were 473, 150 and 300 people per square kilometre, respectively. Give four comparisons. [4 marks]
- Pakistan had the highest population growth at 1.96 per cent, followed by India at 0.81 per cent; China's rate was negative at −0.10 per cent.
- China had the highest urban population share at 65 per cent, compared with Pakistan's 38 per cent and India's 36 per cent.
- Pakistan's fertility rate of 3.4 was highest, India's 2.0 was intermediate, and China's 1.2 was lowest.
- India had the highest population density at 473 people per square kilometre, followed by Pakistan at 300 and China at 150.
Q4. In 2022, India's agriculture, industry and services accounted for 18%, 28% and 54% of GVA and 43%, 26% and 31% of employment. China's corresponding GVA shares were 8%, 38% and 54%, and employment shares were 23%, 32% and 45%. Make six comparisons using these data. [6 marks]
- Agriculture contributed a larger share of GVA in India, at 18 per cent, than in China, where its contribution was 8 per cent.
- India also had a greater agricultural workforce share, at 43 per cent, compared with China's 23 per cent, indicating greater employment dependence on agriculture.
- Industry contributed 38 per cent of China's GVA and 28 per cent of India's, showing a larger industrial output share in China.
- Industry employed 32 per cent of China's workforce and 26 per cent of India's, so China's industrial employment share was also higher.
- Services contributed an equal 54 per cent of GVA in both countries, making this the largest output sector in each economy.
- Services employed 45 per cent of workers in China but 31 per cent in India, despite their equal service-sector GVA shares.
Q5. India's exports to China and imports from China were ₹25,232 crore and ₹31,892 crore in 2004 to 2005, and ₹1,20,617 crore and ₹9,59,666 crore in 2024 to 2025. State the method, calculate exports as a percentage of imports for each year, and interpret the change. [4 marks]
- Divide export value by import value and multiply by 100. Both values must refer to the same year and use the same currency unit.
- For 2004 to 2005, the calculation is (25,232 ÷ 31,892) × 100, giving approximately 79.12 per cent.
- For 2024 to 2025, the calculation is (1,20,617 ÷ 9,59,666) × 100, giving approximately 12.57 per cent.
- Exports were lower than imports in both years, and their proportion of imports fell. This ratio is not a growth rate for exports.
Q6. Pakistan's development experience included agriculture dependent on good harvests rather than institutionalised technical change, stagnation after poor harvests, remittances from Pakistani workers in the Middle East, foreign aid, volatile agricultural exports, increasing foreign loans with repayment difficulties, and political instability. In 2017 to 2018, GDP grew 5.5%, industry 4.9% and services 6.2%. Explain five weaknesses and one qualification to a wholly negative assessment. [6 marks]
- Agricultural growth relied on good harvests rather than an institutionalised process of technical change, making progress dependent on harvest conditions.
- Over-dependence on remittances from Pakistani workers in the Middle East made foreign exchange earnings reliant on income earned abroad.
- Exports of highly volatile agricultural products made foreign exchange earnings unstable.
- Growing dependence on foreign loans was accompanied by increasing difficulty in repaying them.
- Scholars identify political instability, alongside dependence on remittances and foreign aid, as a reason for the slowdown of Pakistan's economy.
- The 2017 to 2018 figures qualify a wholly negative view: GDP grew 5.5 per cent, industry 4.9 per cent and services 6.2 per cent.
Q7. India recorded GDP growth of 7.3% in 2015 to 2017 and 6.5% in 2024. State the direction of change and explain whether the later figure indicates falling output. [2 marks]
- The growth rate decreased from 7.3 per cent to 6.5 per cent between the two observations.
- The later rate remained positive, so it indicates increasing output at a slower rate, not falling output.
Q8. A development assessment reports income, health and education outcomes but leaves out democratic participation, constitutional protection of citizens' rights, judicial independence and the rule of law. Explain four limitations corresponding to these omissions. [4 marks]
- Without democratic participation, it does not show the extent to which people take part in social and political decision-making.
- Without constitutional protection of citizens' rights, it leaves out an important safeguard of people's freedoms when assessing their development.
- Without judicial independence, it does not assess whether courts have protection from improper interference in their decisions.
- Without the rule of law, it misses whether government and citizens are subject to law, limiting the completeness of the assessment.
Key takeaways
- India, China and Pakistan began modern development around the same time and adopted planning, but their institutions and later outcomes differed.
- China introduced reforms in 1978, Pakistan in 1988 and India in 1991, making the pre-reform and post-reform distinction country-specific.
- China allocated commune land for household use while retaining collective ownership, and introduced competition, dual pricing and special economic zones.
- Pakistan's strategy moved from import substitution and nationalisation towards denationalisation, private enterprise and reforms, supported partly by remittances.
- Population growth, fertility, sex ratio, density and urbanisation measure different demographic features and should be compared with their units and dates.
- China followed the gradual agriculture-industry-services pattern, while India's and Pakistan's shifts were directly towards services.
- Services supplied the largest GVA share in all three countries in 2022, but output shares and employment shares differed.
- Human development comparisons require health, education and income indicators, together with attention to liberty, constitutional rights and democratic participation.
- Exports as a percentage of imports uses export value divided by import value, multiplied by one hundred, for the same year.
Test yourself
What were the first planning dates for India, China and Pakistan?
India's first Five Year Plan covered 1951 to 1956. China began in 1953, and Pakistan in 1956.
What did commune members do collectively?
They cultivated land collectively under the rural commune system introduced in China.
What distinguished township and village enterprises?
They were owned and operated by local collectives and were allowed to produce goods during reforms.
What is the meaning of sex ratio in this comparison?
It is the number of females per one thousand males in the population.
Why did the one-child norm raise an age-structure concern?
Lower population growth meant that, after a few decades, elderly people would form a larger proportion relative to young people.
How does the usual sequence of structural change differ from India's and Pakistan's experience?
The usual sequence is agriculture to industry to services. India and Pakistan shifted directly from agriculture towards services.
Why are China's pre-reform health and education policies relevant?
They established social infrastructure that helped improve human development and income indicators after reforms began.
Why should liberty indicators accompany social and income indicators?
They cover democratic participation and constitutional protections that are necessary for a fuller assessment of human development.
Try it
Comparative Development Experiences Of India Notes | Class 12 Indian Economic Development
Test your understanding of the development paths of India, China, and Pakistan.
1In 1978, China introduced major economic reforms. What was the FIRST sector to undergo these reforms?
Incorrect. The industrial sector reforms came later. The initial phase focused on agriculture, foreign trade, and investment.
Correct. In the initial phase (1978), reforms were started in agriculture, foreign trade, and investment. Specifically, commune lands were divided into small plots allocated to individual households, and families could keep all income after paying taxes.
Incorrect. Special economic zones were set up to attract foreign investors, but this came after the initial reforms in agriculture. The text states reforms moved to the industrial sector in the later phase.
2What was the primary reason for China's lower population growth rate compared to India and Pakistan?
Incorrect. While urbanization occurred, the text specifically points to a different factor as the major reason for China's low population growth.
Correct. Scholars explicitly point to the one child norm introduced in China in the late 1970s as the major reason for China's low population growth. The text states population growth is highest in Pakistan, followed by India and then China.
Incorrect. The text does not mention literacy rates as the reason for China's population growth patterns. It specifically attributes China's low growth to the one child norm.
Great work! Review the feedback above to reinforce your understanding of these key concepts.